The KOC Illusion: Why China’s Cheapest Creators Win on Math, Not Trust
China’s KOC economy gets sold to Western marketers as a trust story. Small creators feel like friends. Friends get believed. Belief converts. It is a lovely story, and the numbers do not support it.
They support something duller and far more useful. KOC is a supply-chain story.
Four things are true at the same time, and most decks only show you one of them:
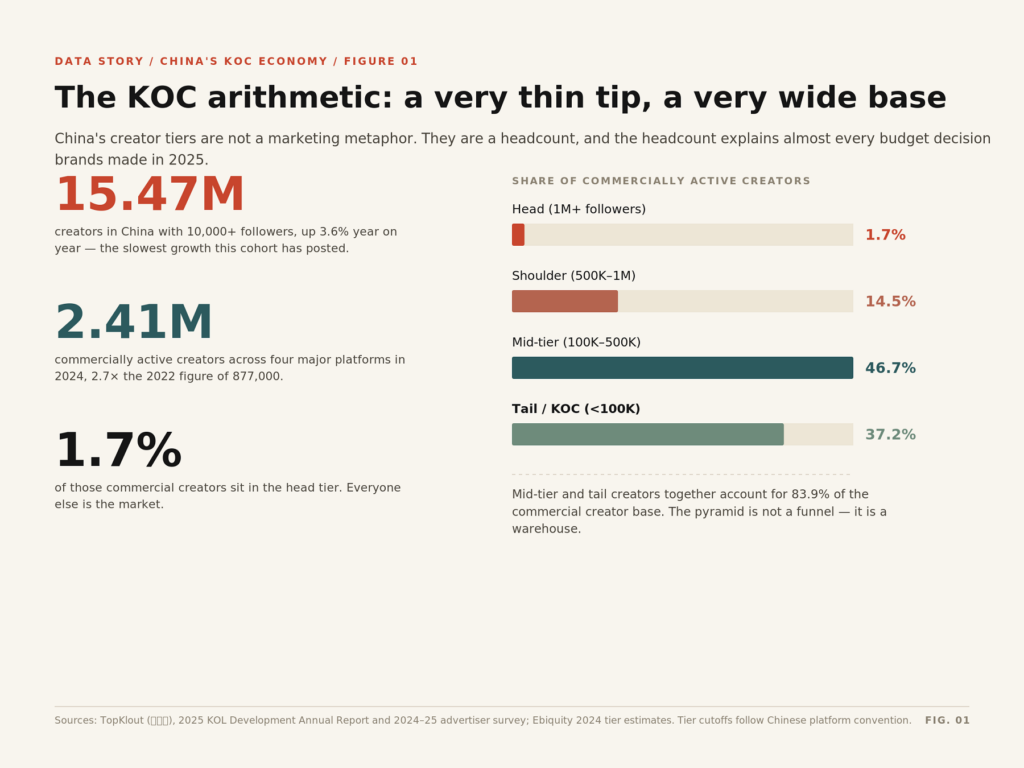
- The tier exists at industrial scale. 15.47 million creators in China had more than 10,000 followers at the end of 2025. Of the 2.41 million commercially active creators tracked across four major platforms, 83.9% sit in the mid and tail tiers.
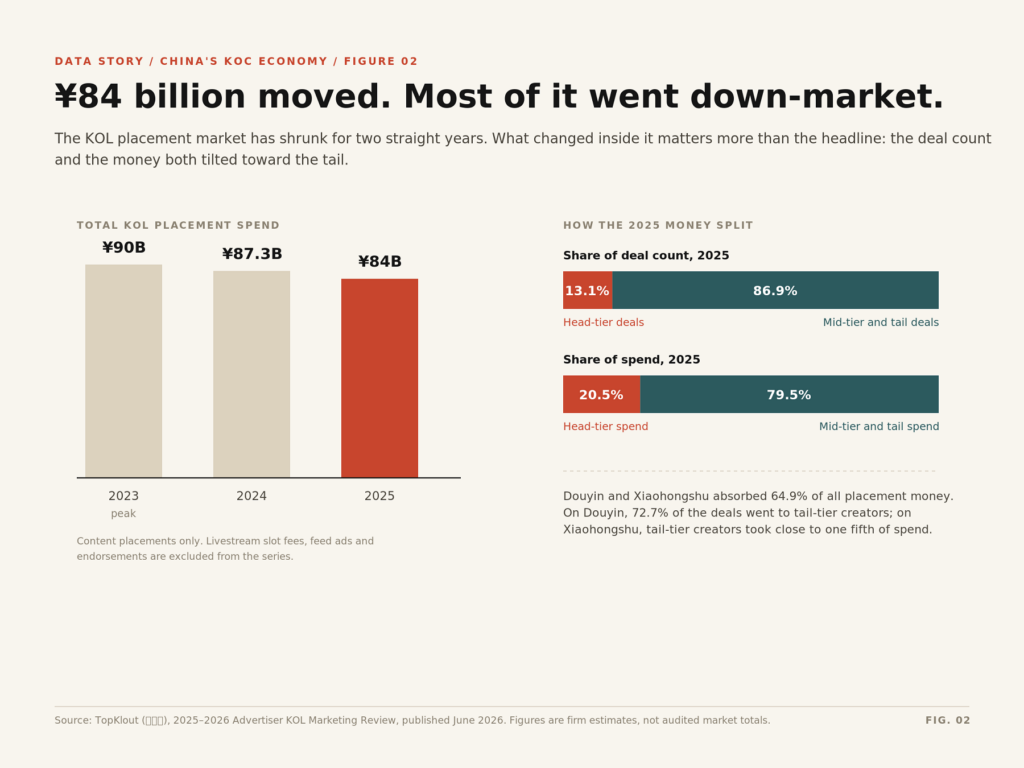
- The money follows them, but not out of affection. Head-tier creators took 13.1% of deals and 20.5% of spend in 2025. Mid and tail took 86.8% of deals and roughly 80% of the money.
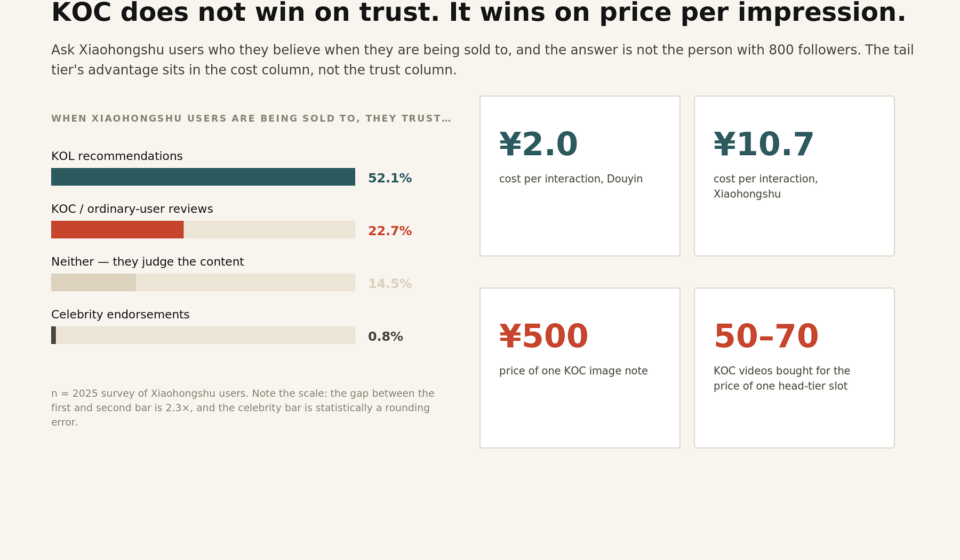
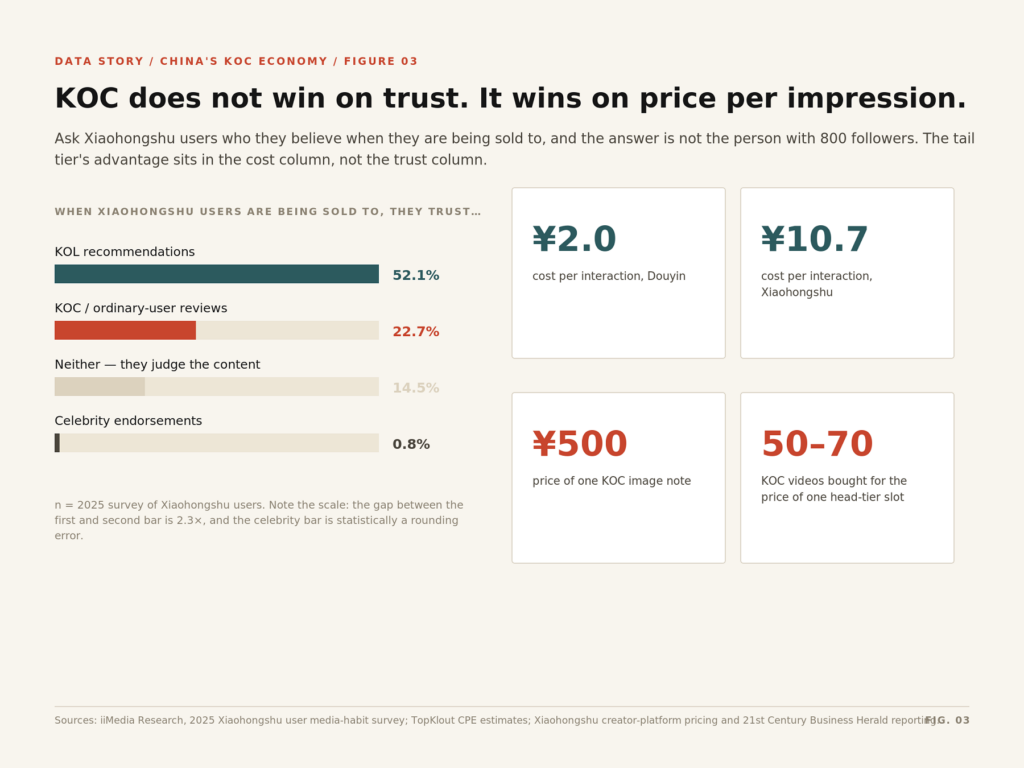
- On trust, KOC loses to KOL, badly. On Xiaohongshu, 52.1% of users say they believe KOL recommendations. Only 22.7% say the same about KOC. Celebrities: 0.8%.
- What KOC actually sells is price per unit of attention, plus inventory. One head-tier livestream slot buys 50 to 70 KOC videos. Those videos keep answering searches long after the invoice is paid.
If you remember one sentence, make it this one: stop paying KOC for a credibility it does not have, and start paying it for an inventory you cannot buy anywhere else.
1. A definition that will save you money
The English translation of KOC is “key opinion consumer”, which sounds like a person with strong opinions and a shopping habit. In Chinese platform practice, KOC is closer to a price band.
Roughly: under 100,000 followers, often under 10,000, frequently a real human being with a day job, a phone, and a bathroom cabinet full of half-used serums. The 1,000 to 5,000 follower range is where Xiaohongshu’s official commercial platform, Pugongying, began inviting ordinary users in 2022. That is the moment KOC stopped being a vibe and became a line item.
This matters more than it sounds. When a Chinese media plan says KOC, it usually means the cheap end of the creator rate card, not a distinct persuasion technology. If your strategist means something grander, ask for two numbers before you sign anything: the follower band, and the cost per engagement. If those numbers are missing, the strategy is decoration.
2. The 86.8% number, and the 20.5% hiding inside it
TopKlout’s 2025–26 review of advertiser spending put China’s KOL content placement market at ¥84 billion. Inside that total, the split looks like a rout. Head-tier creators accounted for 13.1% of deals. Mid and tail took 86.8%. On Douyin, 72.7% of all deals went to tail-tier creators. On Xiaohongshu, tail-tier creators captured close to a fifth of spend.
Now read the same data from the other side, because this is where most commentary stops.
Head tier still collected 20.5% of the money from 13.1% of the deals. Divide one by the other and the average head-tier deal is worth about 1.6 times the market average. Nobody is being starved. The pyramid is not collapsing; it is being rented out by the hour.
That distinction changes the strategic question. If the tail were a trust engine, you would expect its members to command a premium per unit of attention. They don’t. They win on volume, on price, and on the fact that there are simply more of them than there are slots on a search result page.
3. A shrinking market with an exploding unit count
Three numbers in a row: ¥90 billion in 2023, ¥87.3 billion in 2024, ¥84 billion in 2025. That is the first back-to-back decline in the series TopKlout has published since 2023.
Now put the supply side next to it. Creators above 10,000 followers reached 15.47 million, up 3.6%, the slowest growth this cohort has recorded. Commercially active creators across four major platforms hit 2.41 million in 2024, 2.7 times the 2022 figure of 877,000.
A market that shrinks 4% while its unit count grows is a market where the unit price is collapsing. That is the real story of 2025. The budget did not leave creator marketing. It changed shape: away from one expensive post and toward many cheap posts, plus paid amplification, plus search capture.
You can see the same shift in how creators get paid. On Douyin’s Xingtu marketplace, creators under 100,000 followers grew platform income by more than 40% year on year, and 900,000 creators earned there for the first time. The platform also reported that commercial content clearing its quality bar drew 107% more views than run-of-the-mill commercial content, while CPM fell 92%. Translation: the supply of competent commercial content is rising faster than the demand for it, and the price of competence is falling.
That is either your opportunity or your problem, depending on whether you are buying or selling.
4. The number that breaks the official story: 52.1 versus 22.7
Here is the finding that should be printed on the wall of every agency that pitches KOC as a trust upgrade.
In a 2025 survey of Xiaohongshu users by iiMedia Research, respondents were asked whose product recommendations they trust most when they are in the market for something. KOL recommendations led at 52.1%. KOC, the authentic voice of the ordinary user, came second at 22.7%. Users who said they ignore the messenger and judge the content: 14.5%. Celebrity endorsements: 0.8%.
Note what “KOL” means in Chinese usage here. It is not only the ten-million-follower monster. It includes the mid-tier reviewer who has tested forty serums and can tell you which one pills under sunscreen. That is the competition KOC is actually losing to: not fame, but demonstrated expertise.
Why does the trust story fail exactly where 种草 was invented? Two reasons, and both are structural.
The first is signal quality. A creator who has reviewed forty products in one category accrues something a first-time poster cannot fake: a track record. Users read that as expertise, and expertise beats intimacy when money is on the line.
The second is saturation. The more “my honest review” notes a user sees, the more the format itself reads as advertising. Xiaohongshu’s own governance data hints at how far this has gone. The platform removed 13.76 million fake marketing notes in six months, and an independent test of a single category search found that 77.8% of first-page results were ads or content with no useful information. One test is not a census, but a page where four out of five answers are ads or filler has stopped rewarding authenticity and started rewarding volume.
So what is left for KOC? Reach, frequency, and search surface. That is not a consolation prize. It is just a different job, and it needs a different budget line, a different brief, and a different set of KPIs.
5. What KOC actually buys you: the ¥500 note
Small creators on Xiaohongshu charge roughly ¥500 for an image note and ¥600 for a video. Industry cost benchmarks put cost per interaction at about ¥2 on Douyin and about ¥10.7 on Xiaohongshu, a fivefold gap that has more to do with how each platform counts an interaction than with relative efficiency.
Run the arithmetic any media plan runs. ¥50,000 buys a hundred notes at ¥500. Or, as one KOC agency put it, the same money that buys a single head-tier livestream appearance buys fifty to seventy KOC short videos, with content rights attached.
A hundred notes is not a hundred impressions. It is a hundred indexable answers. Even at a 10% hit rate, you end up with ten pieces of content that keep ranking for long-tail queries in your category for months. That is not a persuasion play. It is a content-manufacturing play wearing a marketing hat, and it is the only reason the unit economics work.
One warning, because the rate card lies. Qiangua’s own case library shows two maternal creators with almost identical followings, 294,300 and 290,700. Their image-note cost per engagement was ¥66.99 and ¥16.72. Same tier, same niche, fourfold difference in yield.
6. Engagement: the gradient is real, the interpretation is not
Global benchmarks agree on the direction. On Instagram, nano accounts (1,000 to 10,000 followers) average a 1.78% engagement rate, micro accounts 0.54%, and mega accounts above one million followers 0.33%, according to HypeAuditor’s 2026 State of Influencer Marketing report. On TikTok the same gradient is steeper: 10.3% for nano, 8.7% for micro and 7.5% for mid-tier, per Shopify data cited in PortOne’s 2026 influencer economy report, which puts nano engagement at 2.7 times the mega tier.
Every article you have read about micro-influencers cites a version of this curve. Almost none of them explain the denominator.
Engagement rate is interactions divided by audience. A 500-follower account’s audience is mostly people who know the person. A five-million-follower account’s audience is mostly people the algorithm showed a video to. You are not measuring persuasive power. You are measuring intimacy per capita, and intimacy does not scale.
Which is why engagement rate is a good tool for comparing creators inside a tier and a terrible tool for comparing tiers. Look at absolute interaction instead: Instagram accounts above one million followers still generate a median of 6,678 likes per post. Reach still scales with audience size even when the ratio does not. If your objective is reach, a nano creator is a rounding error. You buy them by the hundred or not at all.
7. Conversion: 1.3% versus 0.7%, and the selection effect that rarely gets mentioned
The conversion data is more encouraging, and more slippery.
Captiv8’s 2025 affiliate influencer report, as covered by EMARKETER, put conversion at 1.3% for creators in the 50,000 to 100,000 band, up 46% year on year, against 0.7% for creators above 500,000. Agency first-party logs report wider gaps, with sub-10,000-follower campaigns converting at several times the rate of celebrity campaigns, though those numbers usually come from portfolios skewed toward performance clients.
Here is the caveat that separates a data story from a sales deck. Part of that gap is a selection effect. KOC programmes tend to be run by brands with tighter niches, better product-market fit, and cleaner attribution through unique links, while celebrity campaigns are often awareness buys measured with a different ruler. Some of the conversion advantage is the creator. Some of it is the campaign design that surrounds the creator.
The direction still holds across markets, which is enough to plan on: at comparable creative quality, smaller creators convert better per impression and much better per yuan. Just do not promise your CFO a fivefold lift and then blame the creators when you get 1.3 times.
8. Inventory: the product behind the product
Everything above is downstream of one structural fact about Xiaohongshu, and it is the fact most Western marketers miss.
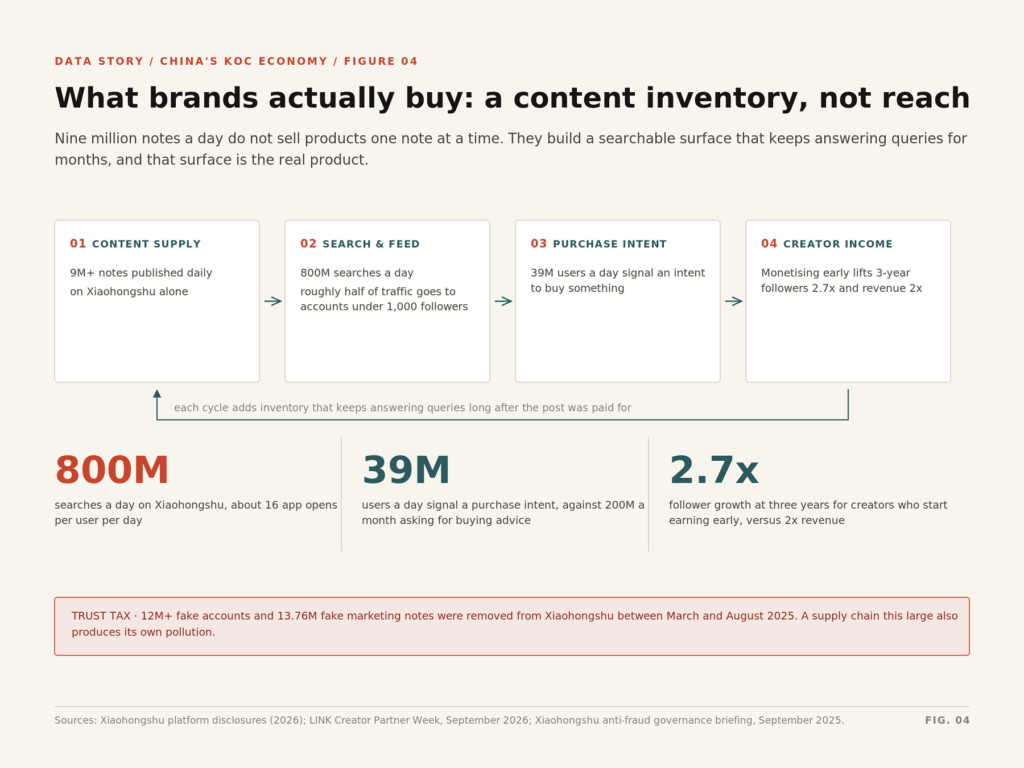
The platform reports more than 400 million monthly actives, 170 million daily actives, 800 million searches a day, and about 16 app opens per user per day. Independent panels are more conservative, and the gap between the platform’s own figure and third-party measurement is worth keeping in mind when you build a TAM slide. What is not in dispute is behaviour: users publish more than nine million notes daily, around 200 million people a month ask the platform for buying advice, and 39 million a day show a concrete purchase intent. Roughly half of all traffic is distributed to accounts with fewer than 1,000 followers, and the recommendation window for longer content runs to 90 days.
That is not a social network with a shopping habit. It is a search engine with a diary attached.
In that system, a KOC note is not an ad impression. It is an index entry, an answer to a query someone will type next March: “sunscreen for rosacea in humid weather”, “gift under 200 for a colleague who just had a baby”. A hundred notes is a hundred entries. Brands build matrices not because each note persuades, but because the matrix occupies the first page of results for the queries that matter.
This is also why cost per engagement misleads. A note with mediocre likes but strong search capture can outperform a viral one on revenue, because the viral note dies in 72 hours while the plain one keeps getting found.
9. The compounding curve: 2.7 times and 2 times
The most under-reported numbers in this market are about creators, not consumers.
At its September 2026 creator conference, Xiaohongshu published a longitudinal study of accounts that began posting in 2023. Creators who started earning at 1,000 followers were 5.8 times as active a year later, measured by whether they were still publishing four or more posts a month, than creators who had never monetised. Creators running both paid orders and livestream selling reached 2.7 times the follower base and 2 times the revenue of non-monetising peers after three years.
On the demand side, the same event reported that highly engaged users spend 15.3 times more per year, buy 6.7 times as often and repurchase 4.2 times as often as everyone else.
Put those together and you get a flywheel that turns on creator economics rather than audience size. Pay creators early, and they keep publishing. They keep publishing, and your category’s inventory grows. Inventory grows, and your share of search grows. Search share grows, and your marginal acquisition cost falls.
The corollary is uncomfortable for campaign-minded teams. If you buy KOC in bursts, you are renting inventory that someone else is compounding. Every year you re-enter the auction at a higher clearing price.
10. The trust tax: twelve million accounts
Now the part that never makes it into the pitch deck.
Between March and August 2025, Xiaohongshu banned more than 12 million fake accounts, removed 13.76 million fake marketing notes, deleted over 360 million fake comments and cut exposure to fake marketing content by 60%. Its takedown response time went from a week to a day or less. In the summer of 2026 it removed another 120,000 AI-generated fake notes in three months, including fabricated clinic visits and a nonexistent sea-view guesthouse.
Read that as a supply-chain disclosure. The same ecosystem that makes a hundred notes affordable also makes it likely that some of those notes are industrial fiction. A market where, in one category test, nearly four in five first-page results were ads or filler does not have a trust surplus. It has a trust deficit that the platform is spending real money to contain.
What does that cost you? Three things, and they all show up late.
Response rates decay first. Then platform risk: brands caught commissioning fake reviews face escalating penalties, and the platform now pursues the brands behind the accounts rather than only the accounts. Then pricing power: when every category is flooded with identical “honest reviews”, the format stops working and you have to buy your way back into attention with paid amplification.
The practical fix is unglamorous. Add a verification line to the budget: account age, posting cadence, comment-pattern checks, cost-per-engagement outliers. And put one clause in every brief that most brands are too polite to write: say something negative, or we will not run it. In a market this saturated, the willingness to complain is the last reliable authenticity signal.
11. Saturation math: why the eleventh KOC earns less than the first
Diminishing returns in KOC do not arrive as a curve. They arrive as three separate walls.
Audience overlap. Thirty notes in a two-million-person category reach the same core audience repeatedly. By the twentieth, you are paying to remind people.
Format fatigue. The template that worked in 2022 now reads as an advertisement to most searchers, which is exactly what the 77.8% figure is telling you.
Price inflation at the bottom. Tail-tier deal volume is rising while per-deal cost falls, but the discount accrues to accounts with real engagement histories. The rest get filtered out of the shortlist before pricing even happens.
The right mental model is inventory depletion, not audience growth. There are only so many credible slots on a first page. Your fortieth KOC in a category is not reaching a new audience; it is buying the fortieth-best shelf position in a store with one aisle.
12. What to do on Monday
Three moves, then a ninety-day operating model you can actually run.
Move budget from peak to base. Somewhere between 60% and 70% of creator spend should sit in always-on KOC and search capture. Keep 30% to 40% for hero moments, because head-tier creators still own the launch week, and 20.5% of the money going to 13.1% of deals is a price signal, not a mistake.
Build infrastructure, not campaigns. A standing roster of 150 to 300 vetted creators per category, refreshed quarterly. A brief template that specifies the query you want to own, not the message you want repeated. And a rights clause, because the highest-return move in most KOC programmes is amplifying the best 10% of content as paid media rather than commissioning more of the mediocre 90%.
Change the scoreboard. Retire reach and impressions for this line item. Track cost per engagement, save rate, branded-search lift, share of first-page answers for twenty priority queries, and 90-day content contribution. If your only KOC metric is likes, you are measuring the wrong organ.
The ninety-day version: month one, audit and build the roster; month two, publish 120 notes against 40 named queries; month three, cut the bottom 40%, put 30% of the budget behind the top 10%, and measure what branded search did.
The part that does not fit on a slide
KOC’s advantage is a market inefficiency, and inefficiencies close.
When 86.8% of deals and roughly 80% of the money are already in the tail, the arbitrage is mostly gone. What remains is execution: better queries, better briefs, better rights, better measurement.
The brands still winning this game are not the ones with the largest matrices. They are the ones whose hundred notes say something their competitor’s hundred notes cannot. Scale bought you the shelf. Only specificity keeps you on it.