Search Ads vs AI Answers: Where the Global Budget Is Actually Moving
The click is disappearing. The budget isn’t. Here is where a trillion-dollar ad market is quietly re-pointing itself in 2026.
1. Two curves that stopped moving together
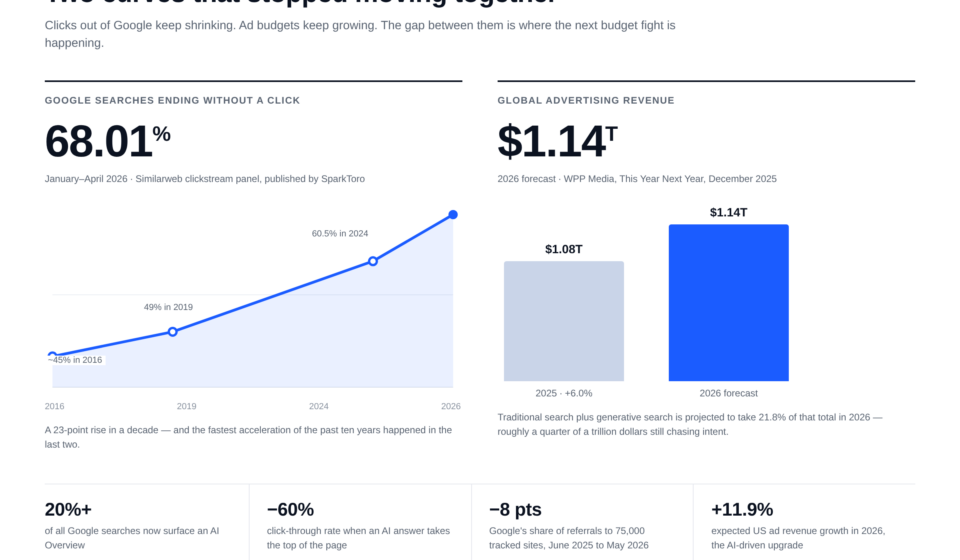
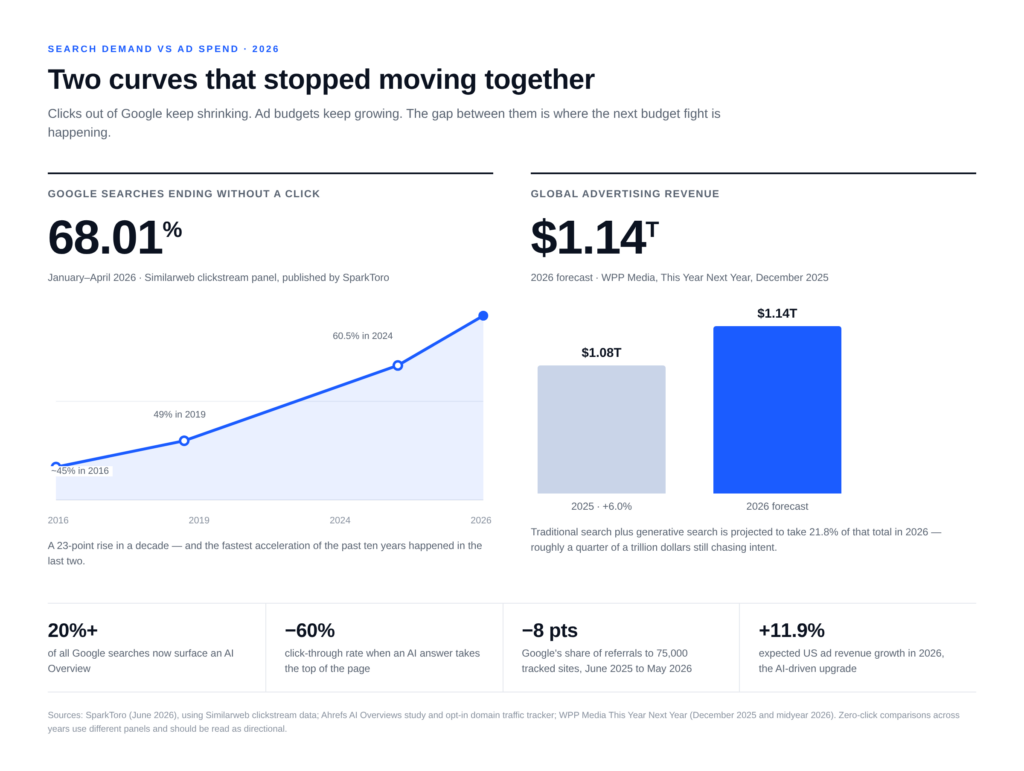
Something odd happened to search in the first four months of 2026. In January, February, March and April, 68.01% of Google searches ended without a click — clickstream panel data from Similarweb, published by SparkToro in June. Ten years ago that figure sat near 45%. In 2019 it was 49%. By 2024 it had reached 60.45%. The line has bent upward by 23 points in a decade, and the steepest part of the bend is the last two years.
Now put the second curve next to it. Global advertising revenue reached $1.08 trillion in 2025, up 6.0%, and WPP Media’s December 2025 forecast put 2026 at $1.14 trillion. In June 2026 the same shop upgraded US ad revenue growth to 11.9%, explicitly crediting the AI investment cycle. Traditional search plus generative search is projected to take 21.8% of that total — call it a quarter of a trillion dollars.
Two curves, one relationship, and that relationship has broken. Demand for answers never went anywhere. What went away is the exit.
The budget is not leaving search. It is leaving the click. And the first place it lands is the brand prompt.
2. The −25% forecast and the money that never left
In early 2024, Gartner predicted that traditional search engine volume would fall 25% by 2026, with search marketing losing share to AI chatbots and other virtual agents. Plenty of planners built 2025 budgets on that sentence.
Here is what actually shows up in the data. Search volume as a behaviour did not collapse. Query demand is stubborn — people still type, still ask, still expect an answer in under a second. What collapsed is the handoff. Zero-click at 68% is not a demand story at all; it is a supply-side story about how demand gets served.
And the invoice never shrank. Advertising revenue grew 6% in 2025 and is forecast to grow again in 2026. If search were dying, the money would be leaving. It isn’t.
That gap between a forecast and an invoice has a lesson buried in it: a forecast can be right about the input and wrong about the unit you actually buy. Nobody buys queries. Brands buy impressions, clicks and conversions. A prediction about query volume was always going to be a poor guide to a media plan denominated in something else.
Which is why the 2024 advice — pull back from search, it’s shrinking — turned out to be expensive. Several teams cut the one channel that was still producing measurable demand, right before that channel’s remaining clicks became scarcer and pricier.
3. Where the answer appears, the click gets expensive
Two pressures push cost per click up, and they are easy to confuse.
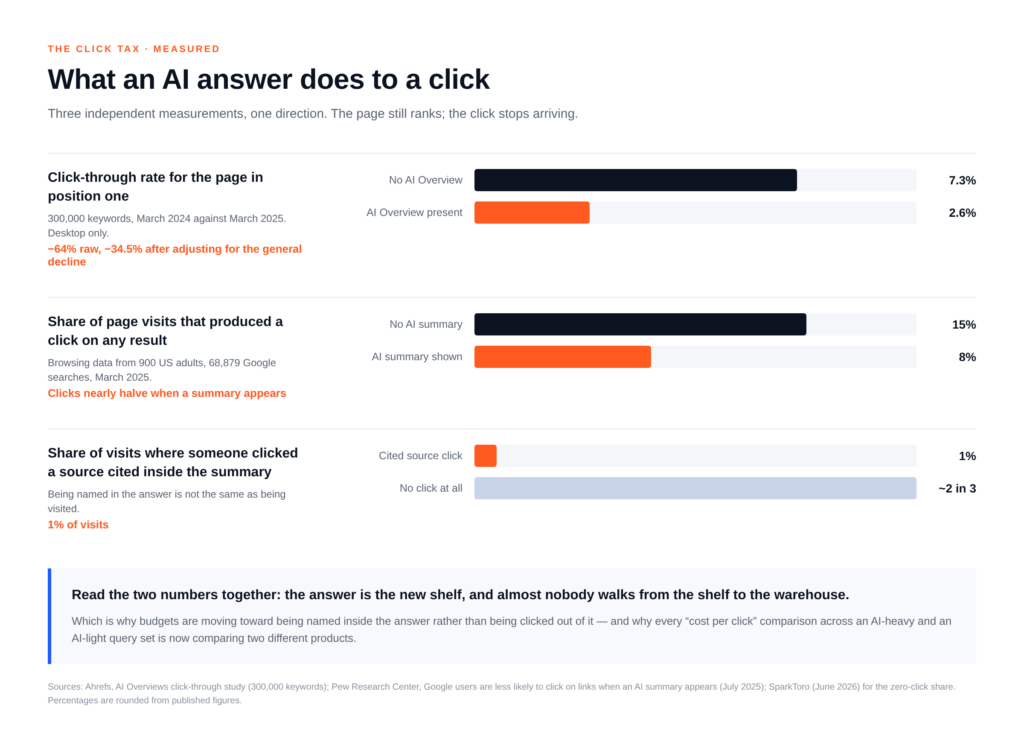
The first is arithmetic. If the top of the page resolves the question, fewer people leave. Ahrefs analysed 300,000 keywords and found that for queries triggering an AI Overview, the average click-through rate for the page in position one fell from 7.3% in March 2024 to 2.6% in March 2025. Adjust for the general decline in informational CTR and the net effect is still −34.5%. SparkToro’s 2026 reading puts the click reduction at close to 60% when an AI Overview is present, which is roughly what you get if you don’t adjust anything at all. Same phenomenon, two different denominators.
The second pressure is competition. The same number of advertisers now chase a smaller pile of clicks on commercial queries, because the informational ones stopped producing billable clicks in the first place.
Pew Research Center’s browsing-panel study makes the human behaviour plain: 900 US adults, 68,879 Google searches in March 2025. When an AI summary appeared, people clicked a traditional result in 8% of visits. When it didn’t, they clicked in 15%. They clicked a source cited inside the summary in 1% of visits.
So the blended CPC in your account is now telling you two stories at once, and averaging them is how budgets get mispriced. Informational queries, which used to drag the average down, are simply leaving the sample. Commercial queries are getting genuinely more contested. One of those effects is measurement. The other is real. You have to separate them before you decide anything.
A quick discipline that works: report CPC by intent tier, flag which keyword groups now trigger AI answers, track cost per qualified session rather than cost per click, and watch impression share on your commercial terms. If impression share is falling while CPC rises, you are being outbid. If impression share holds and CPC rises, you are being re-priced by mix.
4. New inventory: the sponsored answer
For most of the last two years, “AI search” was a traffic problem. In 2026 it became a media channel with its own line in a serious forecast.
WPP Media’s midyear report describes generative search as the fastest channel to $100 billion and folds it into a combined search figure worth 21.8% of global ad revenue. That is the moment a format stops being experimental and starts being budgeted.
What changes when you buy inside an answer?
The unit of sale changes. You are no longer buying a keyword plus a position. You are buying presence in a synthesis — proximity to the question, and the chance to be the source that gets named. Google has said ads would come into AI Mode; Microsoft sells placements inside Copilot conversations; Perplexity sells sponsored follow-up questions. Different mechanics, same direction of travel: the ad moves from the list to the answer.
Comparability drops. Formats are not standardised across surfaces, reporting is thin, and two placements that look alike on a slide may be doing entirely different jobs. Expect your cross-network benchmarks to be quietly wrong for a while.
The creative requirement inverts. In a list, you competed on ad copy and landing page. In a synthesis, you compete on being quotable: verified facts, machine-readable product and price data, consistent entity information across the web, and third-party corroboration a model can lean on. Pew’s data hints at the preference structure — 88% of the AI summaries it examined cited three or more sources, and government sources appeared in 6% of summaries against 2% of standard results. Specificity and provenance travel.
5. The measurement break
Here is the part that keeps performance marketers awake. The moment of discovery has moved to a surface your stack cannot see.
Search Console reports nothing for a query answered in full. A click that never happens does not appear in last-click attribution. Your marketing mix model, calibrated on years of click-and-convert behaviour, is being fed by a funnel whose first stage has gone dark. And the one number that would fix it — clicks on sources cited inside a summary — sits at 1%.
Three bridges work better than a dashboard rebuild.
Geo holdouts. Turn a channel off in matched regions for four to six weeks and measure the difference in total revenue, not platform-reported conversions. Crude, slow, and still the closest thing to truth.
Brand lift in AI surfaces. Survey-based, but it captures the consideration that happens before anyone clicks anything.
A share-of-answer panel. Pick 50 to 100 buying prompts you actually care about, query them on a fixed cadence across the major assistants, and record whether you are named, cited, or absent. Manual at first. Painful. Also the only baseline you will ever have.
6. What performance teams are actually doing in 2026
Strip out the conference language and four moves show up repeatedly.
Splitting brand from non-brand at the account level, not just in reporting. When the two live in the same campaign, automation will find the cheap conversion and call it strategy.
Putting guardrails on automated campaigns — brand exclusions, separate budget caps, and a weekly check on how much of the spend is landing on queries you would have won anyway.
Ring-fencing an answer-layer pool. Not a content team hobby. A budget line with an owner, a prompt list, and quarterly deliverables: structured facts, comparison pages, pricing transparency, feed hygiene, entity cleanup.
Buying the closed loops harder. Retail media and marketplace ads report sales inside the same system that served the ad. As open-web attribution gets murkier, budgets drift toward surfaces that can still close the loop. WPP’s forecast makes the same point from the other side: commerce is becoming the foundation the industry is built on.
The uncomfortable fifth move is contractual. “AI visibility” deliverables without a measurement plan are the 2026 equivalent of a 2010 social media strategy deck — plausible, expensive, and impossible to audit. Ask what will be measured, at what cadence, against which baseline.
7. The PMax correlation trap
Automated campaigns are not stupid. They are obedient. They optimise to the cheapest conversion they can observe, and the cheapest conversion in almost every account is a person who already typed your brand name.
While organic brand clicks were free and plentiful, this was a mild inefficiency. In a 68% zero-click world it becomes a structural problem: the automation buys brand demand that used to arrive on its own, books it as efficiency, and reports a beautiful cost per acquisition while total volume quietly flattens.
Two symptoms give it away. Brand’s share of paid spend creeps up quarter after quarter. Reported CPA improves while total conversions and revenue stay flat. Neither shows up as an error, because nothing is broken — the campaign is doing exactly what it was told.
The fixes are boring and effective: exclude brand from automated campaigns, run brand in its own house with its own target, set new-customer acquisition values where the platform supports it, and calibrate the whole thing against a holdout at least twice a year. Then look at the number that actually matters — incremental revenue per dollar, not reported ROAS.
8. Brand search is the canary
If 68% of searches end without a click, and an AI Overview appears on more than 20% of them, then the brand query has become the most consequential square metre in marketing. It is where a model decides whether to name you, describe you accurately, or hand the moment to a competitor.
Four things worth watching every month:
- Branded search volume — the earliest signal that answer-layer presence is leaking.
- Branded CPC — if competitors can bid on your name and the model can answer without you, this rises first.
- Share of answer on “brand + category” prompts — the specific questions where a recommendation gets made.
- Citation frequency — how often your domain is the source behind the sentence.
None of these are vanity metrics. All four are leading indicators for a revenue line that will move two to three quarters later.
9. Three reallocation scenarios
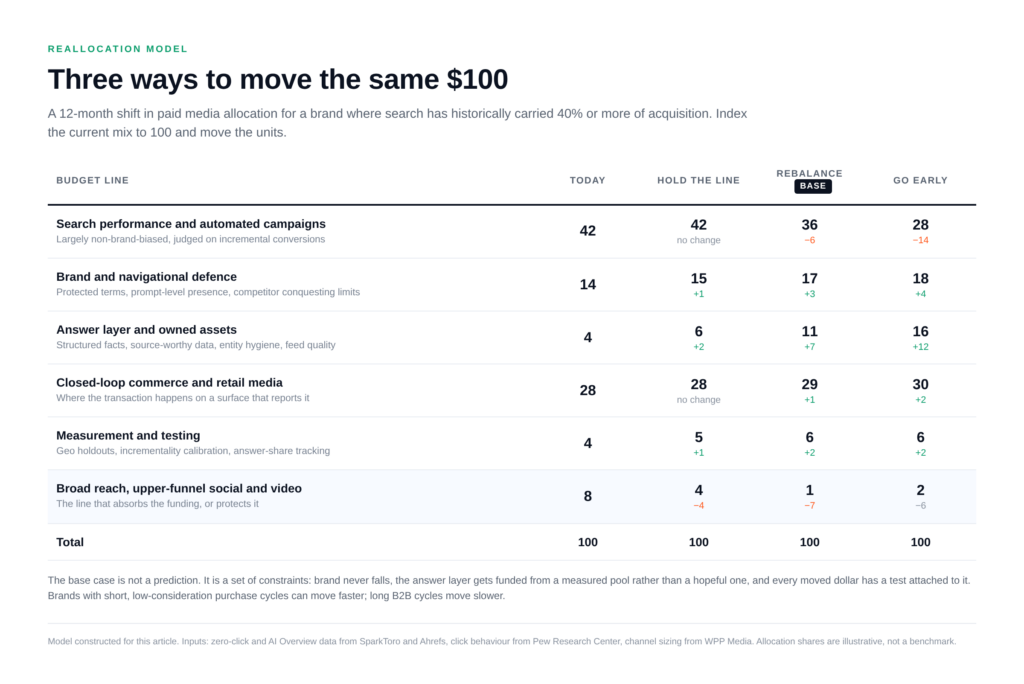
The model below indexes a current paid media mix to 100 and moves units. It assumes a 12-month horizon and a brand where search has historically carried 40% or more of acquisition. It is a set of constraints, not a prophecy.
Hold the line. Nothing moves except a token shift into measurement. Defensible only if your category shows no AI Overview exposure and your brand queries are stable. Check both before choosing it.
Rebalance (base case). Performance and automated campaigns give up 6 points; brand defence gains 3; the answer layer gains 7; commerce gains 1; measurement gains 2; broad reach gives up 7. The logic: fund the answer layer from the pool that automation has been over-buying, not from the pool that still converts.
Go early. Performance gives up 14, brand gains 4, the answer layer gains 12, commerce 2, measurement 2, reach 2. This is a bet that the answer layer compounds before your competitors notice. It is right for short purchase cycles and wrong for categories with long, committee-driven decisions.
10. What to hold back
Four things not to cut, and one not to buy.
Don’t cut brand to fund experiments. Brand defence is the cheapest insurance in the account right now, and it is the line most likely to be raided by a CFO looking at a flat quarter.
Don’t abandon search because CPC is up. A rising CPC on a converting query is a pricing signal, not a verdict. Check impression share first.
Don’t zero out prospecting. The answer layer is a slow asset. If everything rides on it, you will have no demand while you wait.
Don’t let a single quarter of noise trigger a wholesale reallocation. Three months of data in a market this unstable is a rumour.
And the thing not to buy: an AI-visibility score with no stated methodology, no prompt list, and no connection to anything your finance team recognises. There are good tools. There are also expensive screenshots.
11. A twelve-month plan
Q1 — Baseline. Split brand from non-brand structurally. Tag which keyword groups now trigger AI answers. Build the prompt panel. Write down today’s numbers so future you can argue with evidence instead of memory.
Q2 — Build the answer layer. Facts and figures with dates and sources. Comparison and pricing pages a model can quote. Feed and entity cleanup. One owned destination worth citing.
Q3 — Test. Two geo holdouts, one on brand defence, one on the answer layer. Calibrate the mix model with the results. Accept that one test will probably fail; that is what the budget is for.
Q4 — Rebalance and re-contract. Move the units. Reset agency scope and KPIs around incrementality and share of answer rather than clicks and impressions.
12. The one number to watch
If you track one thing in 2026, track share of answer: the percentage of your priority buying prompts where your brand is named in the AI response, measured on a fixed cadence, on a fixed set of assistants, with the exact prompt text archived.
Then divide the money you spend on search plus the answer layer by the number of prompts where you are named, and you have cost per named answer — an ugly name for the only metric that currently sits upstream of both the click you lost and the sale you still want.
It is imperfect. Prompt sets drift, assistants personalise, and a mention is not a conversion. But it leads revenue by two to three quarters, it is cheap to start, and unlike a blended CPC it will not flatter you while the funnel empties out.
The short version
Search advertising is not dying. The click is. Sixty-eight percent of Google searches now end without one, AI Overviews halve click-through when they appear, and cited sources get visited about one time in a hundred. Meanwhile global ad revenue climbs past $1.14 trillion and search plus generative search holds 21.8% of it. The money did not leave; it changed unit. Budgets are moving from buying positions to buying presence in answers, and the brands that win the next two years will be the ones that treated brand prompts as inventory before their competitors did.
FAQ
Is search advertising actually declining?
Not in spend. Global ad revenue grew 6% in 2025 to $1.08 trillion and is forecast at $1.14 trillion for 2026, with search and generative search holding 21.8% of the total. What is declining is click supply on informational queries, which raises the price of the clicks that remain and changes what a search budget buys.
What does “share of answer” mean, exactly?
It is the share of a defined set of buying prompts where your brand is named in an AI-generated response, tracked on a fixed schedule across the major assistants. It is the closest available proxy for presence at the moment a recommendation is formed, and it is a leading indicator rather than a conversion metric.
Does GEO replace SEO?
No. It extends it. Technical hygiene, crawlability and entity consistency still decide whether you can be understood. What GEO adds is quotability: dated facts, clear sourcing, comparison-ready structure, and machine-readable product data. Pages that rank but cannot be summarised cleanly are the most exposed assets in 2026.
How much budget should move to AI visibility?
Enough to run a real test, not enough to break demand generation. In the base case above, seven points of a hundred move into answer-layer work over twelve months, funded largely from automated campaigns that were over-buying brand. Anything above that should be justified by a holdout, not by an article.
How do I prove AI visibility drives revenue?
Three methods, used together: geo holdouts that measure total revenue rather than platform conversions, brand-lift surveys in AI surfaces, and a mix model recalibrated with both. Perfect attribution is not available in 2026. Directional proof, repeated, is.