What Happens to Marketing When the Compute Subsidy Ends
Every click you buy now carries a slice of a data centre. The chip market sets the floor price of that slice, and in 2026 the floor moved in two directions at once: down for tokens, up for everything underneath them.
The short version
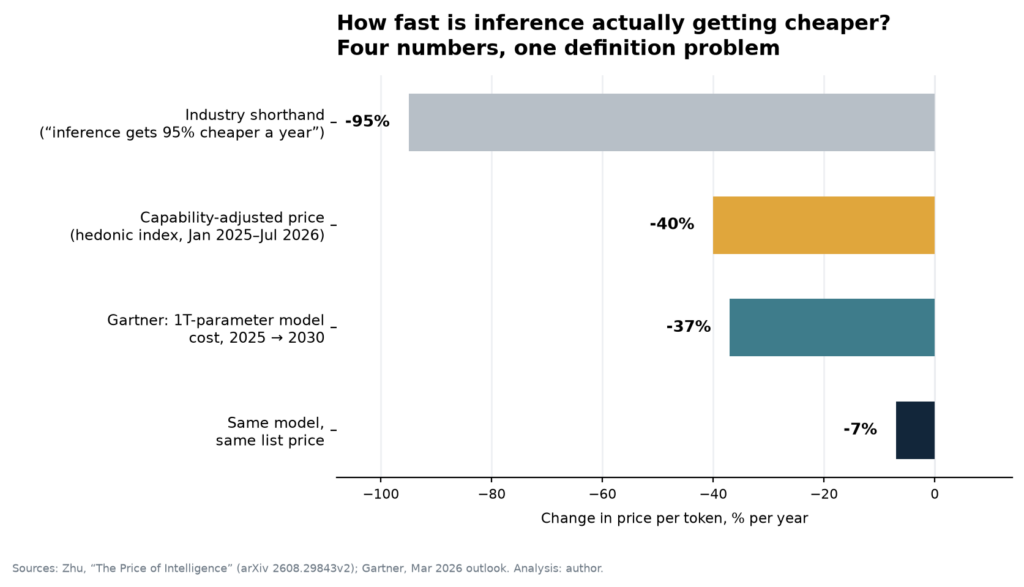
- Inference gets roughly 40% cheaper per year per unit of capability. The same model, at the same list price, gets about 7% cheaper. Both numbers are real. They answer different questions.
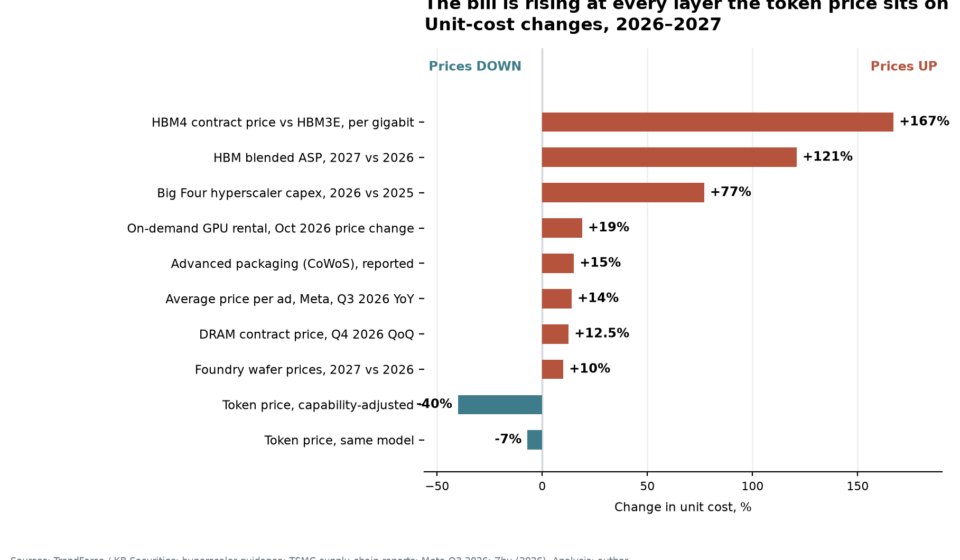
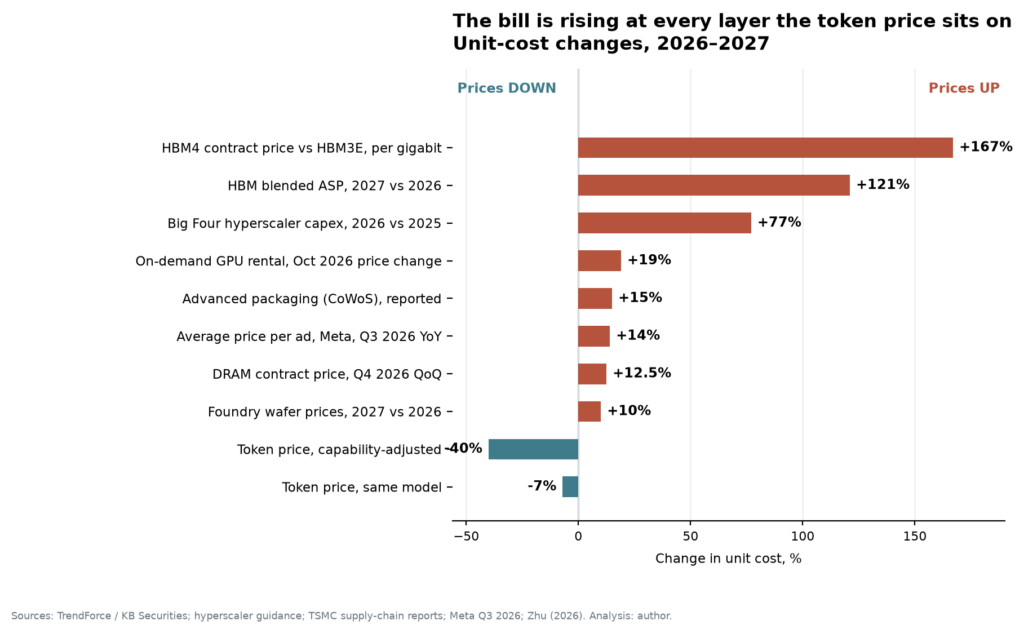
- The physical inputs are inflating. HBM blended selling prices are forecast up 121% in 2027, DRAM contract prices up 10–15% a quarter, foundry prices up to 10%, and GPU rental rates rose in late 2026.
- Your CPM did not follow the token price down. Meta’s average price per ad rose 14% in Q3 2026 while impressions rose 10%.
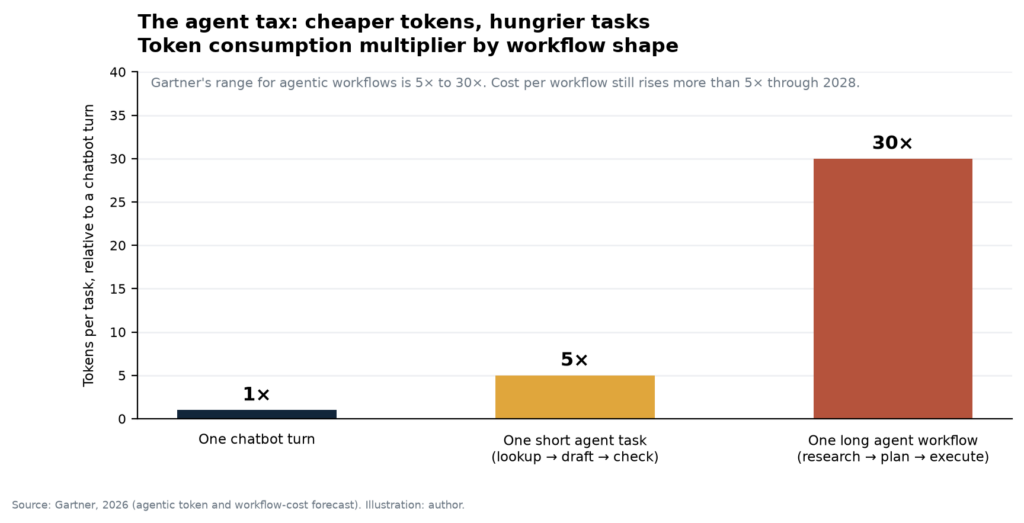
- Agents eat the savings. One agentic task consumes 5–30 times the tokens of a chatbot turn, and Gartner expects cost per agentic workflow to rise more than fivefold through 2028.
- The gap between falling prices and rising costs is financed by capital expenditure: roughly $725 billion across four companies in 2026, up 77% year on year. That is a subsidy. Subsidies have maturity dates.
1. Five pipes, and only two of them appear on your spreadsheet
No marketing budget has a line called compute. That does not mean you are not paying for it.
Creative production. Asset generation, variant multiplication, localisation, resizing, copy adaptation. This one is invoiced, and it is the one everybody watches. It is also the least dangerous, because the unit cost is small and the volume is visible. Meta said close to 10 million advertisers used its generative creative tools in Q3 2026, which tells you the volume is no longer experimental.
Decisioning. Bid shading, budget pacing, audience scoring, creative selection. Every auction touch runs inference inside the platform. You never receive an invoice. You receive a take rate.
Measurement. Marketing mix modelling, incrementality tests, attribution, clean-room joins. Compute-heavy, quietly re-priced, and usually buried in a vendor contract that renews on a different calendar from your media plan.
Always-on content surfaces. Search and answer-engine optimisation, programmatic landing pages, review response, community triage. This is headcount substitution more than vendor spend, which is why it feels free and why nobody costs it.
Customer-facing agents. Product Q&A, chat, post-purchase support, pre-purchase recommendation. Often owned by a different department, and frequently paid for out of a different budget than the campaigns that depend on it.
Then there is the sixth pipe, the one that matters most and appears nowhere: the platform’s own inference bill. It arrives inside your CPM, your CPC, and your cost per acquisition. Two pipes are on your spreadsheet. Four are inside the prices you are quoted.
2. The number everyone quotes is not a measurement
Ask a room of marketers how fast inference costs are falling and you will hear some version of “about 95% a year.” It is repeated in decks, in vendor pitches, in board papers. Try to reproduce it.
The most careful public attempt builds a quality-adjusted price index for text and code inference sold through APIs, joining 21,024 posted prices to a capability scale fitted against 4,605 benchmark scores, covering January 2025 to July 2026. Its finding: on a matched-model basis, same model and same provider at a later date, price per token falls by 0.07 in logs a year. Call it 7%. A hedonic index that holds capability constant falls by 0.51 a year in logs, roughly 40%, and the paper attributes that entirely to newer and better models entering the market rather than to any given model getting cheaper. The authors are explicit: for a completed task, the data do not establish a quality-adjusted decline.
Gartner’s projection sits in the same neighbourhood from a different direction. It expects inference cost for a one-trillion-parameter model to fall more than 90% by 2030 against 2025. Compound that and you get roughly 37% a year. For a model of the same size, Gartner puts the efficiency gain at up to 100 times.
So there are three questions, and they have three answers. Unit cost of capability: down fast. Unit cost of a named model: drifting down slowly. Unit cost of a finished task: not established. If your plan borrows the 95% figure while you buy output rather than capability, you are planning against a curve nobody has measured. The gap between the headline and the measurement is the first place to look for budget risk.
3. The other side of the ledger has been inflating
While list prices fell, the cost of building the capacity behind them went the other way, and not gently.
Memory led. TrendForce forecasts the global HBM market’s blended average selling price up 121% in 2027 versus 2026, with supply tight through the year. Samsung’s HBM4 has been reported at asking prices in the mid-to-high four dollars per gigabit, against roughly $1.50 for HBM3E, and KB Securities expects Samsung’s HBM prices to more than double in 2027. Conventional DRAM, which competes for the same advanced wafer capacity, is forecast up another 10–15% quarter on quarter in Q4 2026.
Foundry and packaging followed. TSMC is reported to be raising prices by up to 10% across leading and mature nodes from 2027. Advanced packaging, the CoWoS layer that every accelerator needs, has been reported under consideration for another 10–20% increase.
Then the counter-intuitive one. GPU rental rates rose. Spot pricing for H100s moved up into October 2026, on-demand rates at some neoclouds were lifted by roughly 17–21% from 1 October, and index pricing for B200 capacity set records. The comfortable assumption that GPUs depreciate and therefore rentals fall did not survive contact with 2026.
And power. US electricity consumption is forecast to hit records in 2026 and 2027, with data centres the main driver.
The single cleanest proof that this reaches operating budgets is Amazon’s own revision: 2026 capital expenditure raised from $200 billion to $220 billion, with the $20 billion increase attributed to higher memory costs rather than to a larger buildout.
4. Why your CPM did not fall with your token bill
People treat two different objects as one. A token price is an input cost. A CPM is the output of an auction. You are bidding against everyone else who also just received cheaper tools.
Cheaper tools do three things to an auction: they raise the number of bidders, they raise the number of variants each bidder can test, and they raise the volume of inventory being optimised in real time. The clearing price then absorbs most of the saving. This is not a theory. It shows up in the reported numbers.
Meta’s third quarter of 2026: ad revenue of $63.1 billion, up 26%. Ad impressions up 10%. Average price per ad up 14%. Demand for attention grew faster than attention did.
Alphabet’s third quarter: search ad revenue of $63.3 billion, up 12%, on query volume up around 12%. Management conceded that AI Mode monetises worse per query than classic Search. That is the second half of the mechanism. The new surface costs more compute to serve and earns less per impression, so the platform has to recover the difference somewhere. It usually recovers it in auction density, ad load, or a richer ad unit.
Practical translation: if your acquisition cost improved in 2026, the cause was targeting, creative volume, or measurement. Not a falling token price. It is worth testing that claim directly. Strip the AI-assisted bidding out of an account and see what survives. In most accounts something survives. It is rarely the whole improvement.
5. The agent tax
Cheaper tokens plus hungrier workflows equals a larger bill. Gartner calls this the Inference Paradox. Routing a task to an agentic reasoning model raises the provider’s inference cost by at least five times compared with a basic chatbot interaction, and agent workflows consume 5 to 30 times more tokens than the chatbot equivalent for the same job. Gartner’s forecast: inference cost per agentic workflow up more than fivefold through 2028, even as token economics improve.
Two mechanisms drive it. First, labs do not bank their efficiency gains; they reinvest them into larger and more expensive frontier models, so the price ladder keeps growing rungs. Gartner’s analyst points out that a newer model can cost more per token than the flagship it sits above. Second, consumption expands to fill the budget: multi-step loops, tool calls, repeated context, retries, and the human time spent checking a plausible-looking wrong answer.
The 2026 pattern was easy to see from the outside. Spending surged in the spring as teams shipped agentic features, then entered a belt-tightening phase once finance noticed the run rate. That oscillation is not a flaw in execution. It is what happens when a variable cost is dropped into a fixed budget with no owner.
6. The capex clock runs slower than the budget clock
Capacity is ordered 18 to 24 months before it serves a single token, financed over five to six years, and increasingly locked by multi-year agreements. Amazon’s contracted backlog reached $496 billion with commitments stretching into 2028, and its chief executive said capacity would fall short of demand in 2026 and again in 2027. Total 2026 capital expenditure across Amazon, Alphabet, Meta and Microsoft lands near $725 billion, up 77% on 2025.
Your plan runs on a different clock. Annual budget, quarterly reforecast, and an AI allocation that is a share of the total rather than a costed unit. Gartner’s 2026 CMO survey puts AI at 15.3% of marketing budgets, with only 30% of marketing organisations judged ready to scale what they have bought.
The mismatch has a specific consequence. What you pay in 2027 is largely determined by capacity decisions taken in 2025, and that capacity is already contracted. If you plan on the assumption that this year’s price cuts simply continue, you are assuming a supply response that has been sold forward. When memory gets expensive, the increase does not stop at the hyperscaler’s income statement. It travels.
7. What happens when the subsidy ends
Define the word precisely. A subsidy here means selling inference below fully loaded cost in order to buy share, data, or strategic position, with investors financing the difference. That is ordinary behaviour in a growth market, not a scandal. The question is how it ends, not whether.
Three channels, in the order they tend to appear.
Packaging. Credits, rate limits, capability tiers, latency tiers, trimmed free allowances. The published list price stays where the announcement put it while the effective price rises. This is the most likely path because it is the least visible.
Quality gating. The good model moves behind a higher tier and the cheap one stays cheap, then gets applied to work it is not good at, and you pay for that in review hours. Gartner’s framing is precise: basic AI functions approach near-zero cost while compute for advanced reasoning stays scarce. That describes a two-tier market, not a cheap one.
List prices. The blunt instrument, and usually the last resort, because competitive fear suppresses it longest.
Pricing behaviour is already discontinuous. In September 2026, OpenAI and Anthropic both shipped cheaper models on the same day, with OpenAI’s new tiers at roughly half the per-token cost of their predecessors, while premium tiers moved the other way. A cheaper floor and a pricier ceiling is what a market looks like when a subsidy is being rationed rather than withdrawn.
8. Routing is the hedge, and it is already mainstream
The most effective cost control is not a harder negotiation. It is refusing to send a ten-dollar task to a model priced for fifty.
Gartner’s recommendation is to institutionalise inference tiering: automated routing, a block on default invocation of frontier models for routine work, and an orchestration layer that defines where each model sits. That is procurement discipline applied to a variable cost.
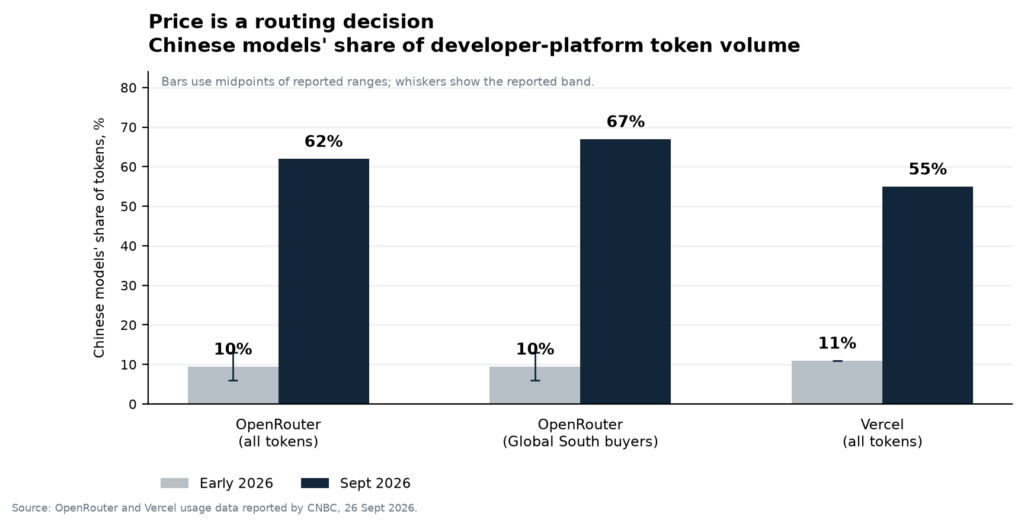
The market has already voted on this. On OpenRouter, Chinese models went from 6–13% of tokens in February 2026 to 57–67% in the week of 14 September. On Vercel, from 11% in January to 55% in August. Buyers in the Global South routed harder still, at about two-thirds of their tokens. The driver was not geopolitics. It was the price gap, once quality cleared the bar for the job.
Rules that survive contact with reality: route by task class rather than vendor loyalty; keep two suppliers per class so you can switch inside a quarter; benchmark on your own evaluation set rather than public leaderboards; and price the retry multiplier, because a cheap model that needs three attempts is not cheap.
9. Why smaller brands are relatively advantaged, and absolutely exposed
Two asymmetric effects, and they point in opposite directions.
The relative advantage: a small brand carries no five-year compute commitment, no legacy data platform whose economics are already sunk, and can build a workflow around cheap inference from scratch. A large brand has to migrate, and migration is paid for in exactly the years when input prices are rising.
The relative disadvantage: volume discounts, custom terms, price caps, and proprietary data all accrue to scale. A large advertiser can sign a multi-year cap. A small one accepts list.
The honest reading is that falling unit costs compress the absolute gap in what a lean team can produce, while widening the gap in sophistication, because routing, evaluation, and cost telemetry are skills rather than purchases. The team that can measure tokens per outcome will beat the team that cannot, in every scenario in the next section.
10. Build the cost model in an afternoon
Most marketing teams cannot answer a basic question: what does one finished task cost? The formula is short.
Cost per 1,000 tasks = (tokens per task × price per token × retry multiplier) + orchestration overhead + (human review minutes × loaded rate)
Two things go wrong when people build this. They measure tokens per call instead of tokens per completed task, which understates the real number by however many retries and corrections the workflow needs. And they leave out the last term, which is usually the dominant one.
The third error only bites self-hosters. On identical H100 hardware, effective cost per million output tokens spans $0.21 to $15.25 depending on utilisation, with the penalty at low request rates running into double digits. Self-hosting looks cheapest in a calculator and most expensive in a deployment running three requests per second.
| Row to fill in | What it captures | Where teams get it wrong |
|---|---|---|
| Task definition | The unit you actually buy | Counting calls instead of completions |
| Tokens per task | Input plus output, including context re-sends | Ignoring context growth in loops |
| Model tier | Which model serves which step | Sending everything to the frontier |
| Price per million tokens | Current list, both directions | Using last year’s number |
| Retry multiplier | Attempts per accepted output | Assuming 1.0 |
| Human minutes | Review, correction, approval | Leaving it at zero |
Re-price the sheet every quarter. Input prices now move more often than plans do, and a model that was right in January is a liability in October.
11. Three scenarios for 2027
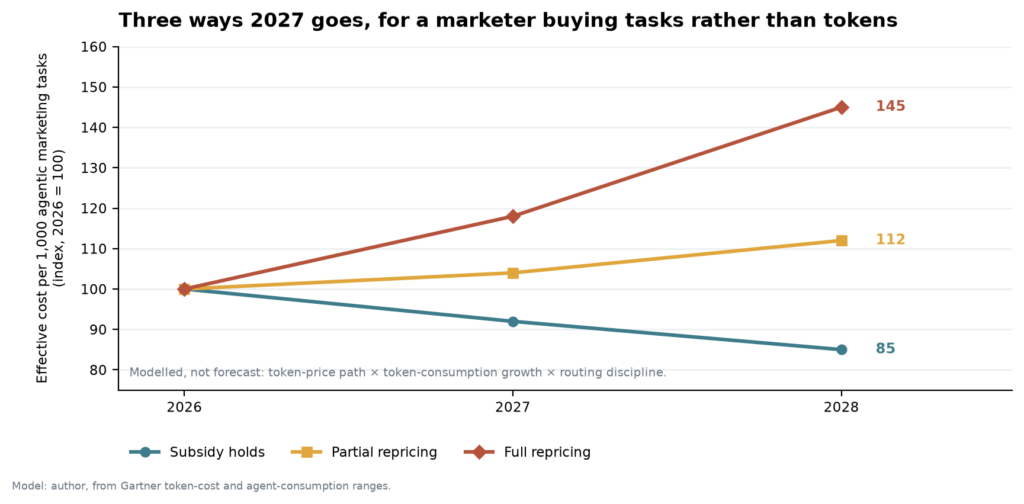
Subsidy holds. Token prices keep falling faster than input costs rise, capex keeps being financed, and effective cost per task drifts down. Media inflation continues at a modest pace. Implication: push volume, keep routing flexible, avoid long commitments.
Partial repricing. List prices flatten, packaging tightens, hardware costs pass through in selected categories. Effective cost per task lands roughly flat to 12% higher. Implication: get the per-task model built now and negotiate caps while you still have leverage.
Full repricing. Memory and power costs dominate, investors discipline capex, tiering becomes standard, and the cheap tiers degrade in quality. Effective cost per task up around 45% against 2026, on the same workload. Implication: pre-buy capacity, lock routing, and give every agentic feature a named cost owner.
What separates the scenarios is observable in advance: whether capex keeps being financed, whether memory stays tight, and whether agent adoption outruns price declines. TrendForce currently expects memory tightness through 2027, which is why the middle scenario is the one to plan against and the third is the one to hedge.
12. Eight indicators worth watching
| Indicator | Why it matters | What would change my mind |
|---|---|---|
| Matched-model token price | Separates pass-through from subsidy | Two consecutive quarterly cuts on the same model |
| HBM blended ASP and HBM4 contracts | Upstream cost with the shortest lag | Contract prices flattening into 2027 |
| DRAM contract price, QoQ | Precursor to packaging changes | Two negative quarters |
| GPU spot rental index | Physical scarcity, independent of tokens | Rental falling while utilisation stays high |
| Hyperscaler capex revisions | Whether the subsidy is still funded | Downward revisions, or funding by asset sales |
| Ad price per impression | Where your savings actually land | Price per ad falling alongside impressions |
| Tokens per completed task, your own stack | Whether your workflows are getting hungrier | Ratio falling without a quality drop |
| Power contracts and data-centre tariffs | The slowest, most permanent input | New supply coming online ahead of demand |
If you watch one, watch the sixth. The gap between token prices and ad prices is the number that decides whether any of this reaches your budget this year.
The bottom line
Compute is a media cost now, with a hardware supply chain attached, and marketing budgets are exposed to it whether or not the line item exists. The 2026 price war is genuine, and it is a subsidy: funded by roughly $725 billion of capital expenditure, delivered as falling prices per unit of capability, and paid for in rising costs at every layer underneath. Plan in tasks rather than tokens, route like a procurement officer, and put an expiry date on your cheap-token assumption.
Frequently asked questions
Is compute really a marketing cost, or is this a platform problem?
Both, and the split matters. Platforms absorb some of it in their gross margin and pass the rest through auction pricing. What reaches you is not a token bill but a CPM, a CPC, and a cost per acquisition. That is why the exposure is real even when the invoice is absent.
Why would my CPM rise while tokens get cheaper?
Because they are different objects. Tokens are an input to the platform; CPM is an auction output shaped by how many bidders share the same cheap tools. Cheaper tooling raises bidder count and optimised inventory, and the clearing price captures the difference. Meta’s average price per ad rose 14% year on year in Q3 2026.
Should I move everything to the cheapest model?
No. Route by task class. Cheap models are now credible for a wide band of routine work, which is why their share of token volume on developer platforms jumped from single digits to a majority in seven months. They remain a poor fit for tasks where a wrong answer costs more than the tokens saved.
What belongs in a 2027 AI budget line?
Three things, costed separately: a per-task cost model with a retry multiplier, a routing and evaluation budget, and a contingency for a packaging change rather than a list-price change. The contingency matters more, because packaging is how price rises without an announcement.
If I only track one number, which one?
Tokens per completed task in your own stack, divided by what that task used to cost you in human hours. Price per token tells you about the market. That ratio tells you whether you are winning.