The Incentive Behind the Number Nobody Can Source
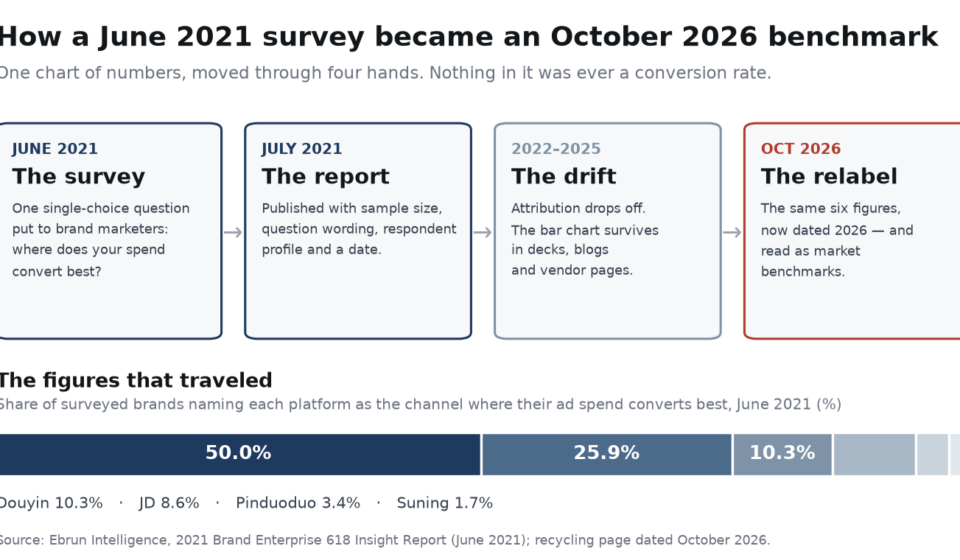
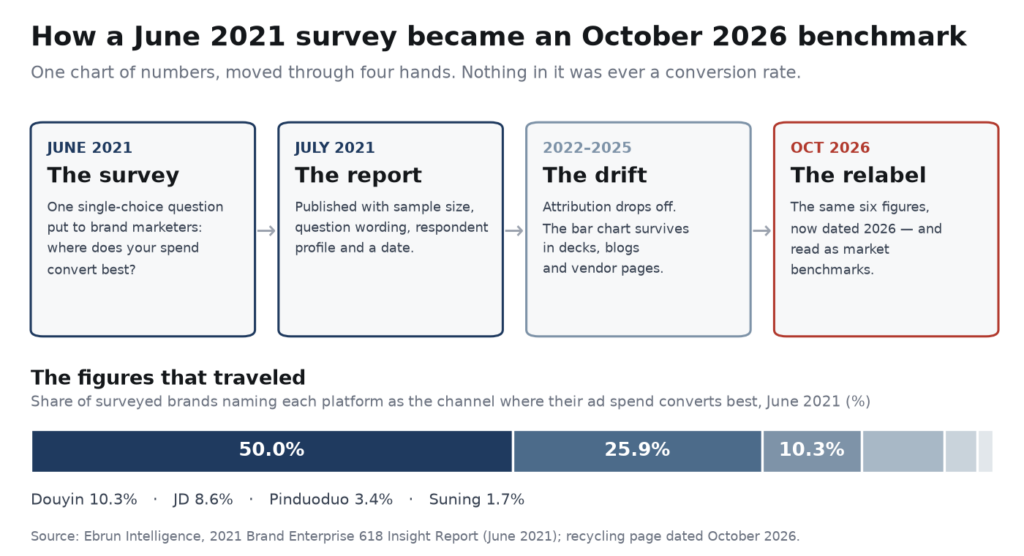
Search for China platform conversion rates and you will meet the same six numbers within a minute: 50 percent of brands say Tmall converts best, 10.3 percent say Douyin, 8.6 percent JD, 3.4 percent Pinduoduo, 1.7 percent Suning, 25.9 percent other.
They arrive without a year, usually without a source, and always without a denominator. So I went and read the original.
It is a vote count.
In June 2021, Ebrun Intelligence surveyed brand marketers with a single-choice question — which platform gives you the best return on your advertising spend? Half picked Tmall. That 50 percent is a share of respondents who chose an answer on a form. It is not a rate of anything, and says nothing about how many shoppers completed a purchase. A survey of forty people and a survey of four thousand produce the same headline 50 percent, which is precisely why it travels so well.
What happened next is not really a media story. It is an incentive story.
Conversion data has demand and no supply. Platforms will not publish conversion rates, because conversion is what they sell; publishing it would turn a pricing conversation into an audit. Procurement teams still need a comparable figure to put in a business case. Agencies need something defensible in a pitch. When demand exists and supply does not, synthesis fills the gap — and a number that appears in a deck once will appear in the next deck, with a citation, then a date, then a life of its own.
The result is not one bad page. It is a chain. A report-summary page dated October 30, 2026 carries all six figures, and alongside them the turnover table from that same 2021 report — Taobao and Tmall at 6.59 trillion yuan, a figure for 2020. Nothing on the page is false in isolation. Everything is false in aggregate: 2021 opinions and 2020 turnover, presented as 2026 market structure.
Why this costs money is subtler than it looks. The type of the number changed in transit. A share of respondents became a conversion rate, and once that happens, a brand comparing its own 3 percent checkout conversion against a published 50 percent has only two possible reactions: my funnel is broken, or this market is unreachable. Both are wrong, and both misdirect budget — one into panic-fixing creative, the other into writing off a channel that was never measured.
Nobody gets fired for citing a benchmark. People get fired for missing a target. That asymmetry, not laziness, is what keeps the chain alive.
Field notes: three questions will settle any China benchmark in ten minutes. What is the denominator, and is it users, sessions or orders? Who answered, and how many? And when was the fieldwork done, as opposed to when the page was published? If the answer to all three is “not stated”, you are not looking at a measurement. You are looking at a screenshot of one.
There is a newer cost, too. These pages are now the raw material that answer engines summarise back to you, so the recycling no longer stops at the next agency deck. The 2021 vote is being taught to machines as a 2026 fact.
The honest version of that number is duller and more useful: in a survey of brands conducted in mid-2021, half said their ad spend worked hardest on Tmall. Whether that is still true is a question nobody has answered since — which is exactly why it is still being quoted.