The End of Double-Digit Growth: China’s Ad Market, Decoded for 2026
China Digital Marketing 2026 Outlook — English Manuscript (Oct 2026)
Most people reading a China marketing report are not in China. They sit in London, Singapore, New York or Berlin, they own a budget line for a market they visit twice a year, and they need one thing: a defensible picture of where the money goes and what changed since the last planning cycle.
That is the job of this report. It is not a tour of Chinese platforms. It is a reading of the published numbers, with the measurement caveats attached, so that a plan built on it survives contact with a finance review.
Data cut-off: October 2026. Where two credible sources disagree, both are shown and the reason for the gap is explained.
Executive summary
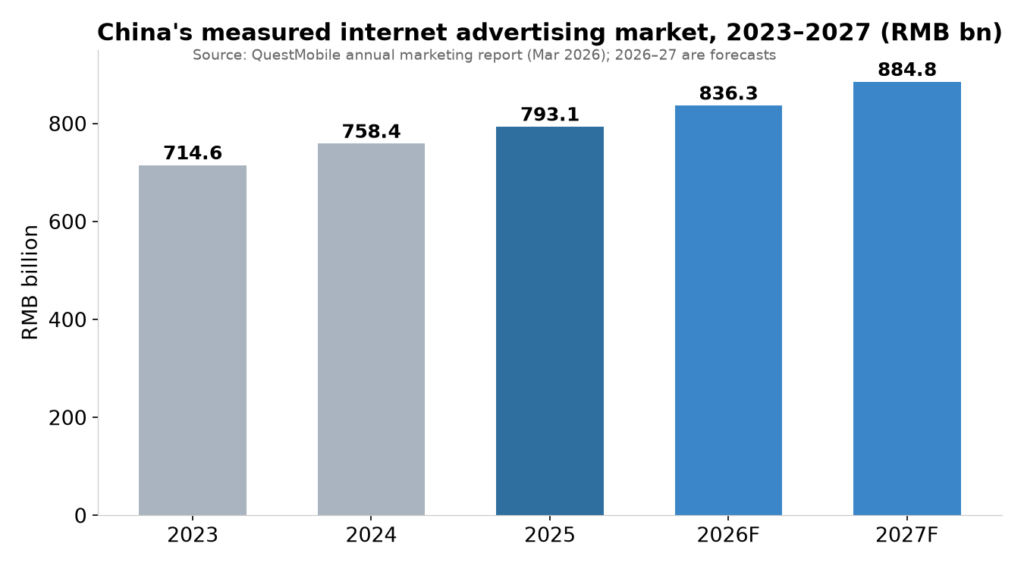
Growth is mid-single-digit, and that is the new normal. China’s measured internet advertising market was worth RMB793.1 billion in 2025, up 4.6 per cent. It reached RMB385.3 billion in the first half of 2026, up 7.1 per cent, and is forecast to finish the year near RMB836.3 billion. No full year in this series has grown faster than 6.1 per cent since 2023.
Ad spend is outrunning the demand it serves. Retail sales rose 1.1 per cent year on year in the first three quarters of 2026, while services retail rose 5 per cent. Brands are paying more to reach consumers who are spending less. That gap, not platform innovation, is the pressure behind every efficiency conversation in Chinese marketing right now.
The increment went to short video, and search lost share without losing revenue. Three sellers take 52.4 per cent of hard-advertising revenue. Budgets tilted further into short video during 2026, in-platform e-commerce held its share, and news, long-form video and search gave ground.
A decade-long trend reversed. Performance advertising fell from roughly 90 per cent of hard-ad budgets to about 80 per cent in the first half of 2026, with brand advertising taking the difference. Part of this is the scarcity of cheap performance inventory; part is e-commerce platforms pulling back from public-domain buying.
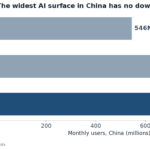
AI became the front door, not a side channel. China passed 700 million generative AI users by mid-2026. AI-native apps reached 546 million monthly users in September 2026, up 82.1 per cent, and users open them 88 times a month. Counting assistants embedded in super apps and phone systems, and accepting that the surfaces overlap, 1.16 billion people touch a comprehensive AI assistant each month.
Generative engine optimisation became a written standard. The China Advertising Association published three group standards on 14 October 2026, effective 23 October, covering service requirements, effect monitoring and verification, and the classification of content sources. This is the first attempt anywhere to turn answer-engine visibility into an auditable discipline.
The constraint is measurement, not tooling. In Adobe’s 2026 global marketing survey, 84 per cent of organisations missed at least one marketing opportunity in a quarter because a workflow could not respond in time, and only 7 per cent had embedded AI in ways that produced measurable business results.
Globally the picture is brighter and simpler: a USD1.3 trillion to USD1.34 trillion advertising market in 2026, with social, retail media and search carrying two thirds of it, and AI-referred traffic still small but converting far better than the average visit.
1. Two official totals, and why they differ by more than a trillion yuan
China publishes two numbers for advertising, and the gap between them is large enough that people quote whichever supports the point they were making.
The State Administration for Market Regulation put total advertising business revenue at RMB2.05 trillion for 2025, with internet advertising business revenue at RMB1.36 trillion. Internet accounted for 89.1 per cent of media advertising publishing revenue. Xinhua reported that the industry crossed the RMB2 trillion mark for the first time.
QuestMobile, working from what media platforms actually book, put internet advertising at RMB793.1 billion for the same year.
Neither is wrong. The regulator counts advertising businesses above a reporting threshold, so agencies, production houses and service providers sit inside its total alongside media owners. QuestMobile counts platform revenue only. Use the regulator’s figure to size an industry, count employment and talk to government. Use the platform series to compare channels, because it is the only one that puts sellers on a consistent basis.
This distinction matters because it changes the growth story. The wider count grew 32.6 per cent in 2025, which tells you the reporting base widened rather than that spend tripled in a year. The measured series grew 4.6 per cent. When someone shows you a chart of Chinese advertising exploding, check which denominator they used.
A third figure is worth carrying: advertising spend per capita. WARC puts China at USD170 in 2026, against USD1,395 in the United States and USD13 in India. China is a large market because it has a lot of people, not because it has a saturated one.
2. The measured series: four years of deceleration
| Period | Measured internet ad market (RMB bn) | Year on year |
|---|---|---|
| 2023 | 714.6 | — |
| 2024 | 758.4 | +6.1% |
| 2025 | 793.1 | +4.6% |
| First half 2026 | 385.3 | +7.1% |
| 2026 forecast | 836.3 | +5.4% |
| 2027 forecast | 884.8 | +5.8% |
Two readings matter here.
First, 2025 was the slowest year in the series, and 2026 opened faster than the year it followed. A 7.1 per cent first half does not mean the market reaccelerated to 2018 levels. It means the base was soft and campaign timing shifted. The full-year forecast of 5.4 per cent is the number to plan against.
Second, all of these rates are nominal. In a category where ad load and price both move, a 4.6 per cent year is a real increase in spend and only a modest increase in the value of inventory. If your China plan assumes rising CPMs will be absorbed by rising budgets, you are modelling the wrong decade.
Set the series beside the demand it serves and the tension becomes obvious. Retail sales of consumer goods were RMB37 trillion in the first three quarters of 2026, up 1.1 per cent. Services retail grew 5 per cent. Advertising grew faster than both. Marketing intensity is rising in a slowing consumption economy, which explains why every platform conversation in 2026 turned into a conversation about return on spend within two meetings.
3. Where the increment actually went
QuestMobile’s first-half 2026 report reads like a budget memo. Its summary: budgets tilted further toward short video, in-platform e-commerce advertising held its position, and news, long-form video and search lost share.
Short video took the increment because it is the only surface where attention still compounds. Douyin alone reported 1.009 billion monthly users and 712 million daily users on 18 June 2026, with monthly users up 14.4 per cent year on year. That is not a channel inside a plan. That is the floor of the market.
E-commerce held its share while the money behind it moved. Advertising sold inside Taobao, Pinduoduo and JD kept its position in the measured market. What changed was merchant behaviour: online shopping brands cut public-domain ad budgets and pushed money into user subsidies and live rooms. Read this as a squeeze on the advertiser side rather than the seller side. A plan that assumes rising e-commerce ad prices through 2027 is building on a trend that has already turned.
Search lost share, which is not the same as losing money. AI assistants now answer the generic question before a results page loads. What survives is the query with commercial intent attached: a price, a warranty, a dealer in a named city, a part number. QuestMobile’s June 2026 read names search among three app categories where both users and time per user fell year on year. The revenue held because the surviving queries are the expensive ones.
The most interesting shift is the mix reversal. Performance advertising made up about 90 per cent of hard-ad budgets in previous periods and fell to about 80 per cent in the first half of 2026, with brand advertising taking the difference. After a decade in which every yuan had to be accountable, brand budget came back.
Two forces produced it. Cheap performance inventory thinned out as e-commerce platforms reduced public-domain buying, so the marginal return on performance spend fell. At the same time, short-video auctions reward creative volume and recall, which are brand metrics measured on performance dashboards.
A new advertiser category arrived. Chinese AI application companies now buy media the way venture-funded companies buy it: fast, concentrated and in public. QuestMobile’s 2025 annual work found that 70 per cent of the hard-ad budget placed by AI application companies went to three products, split 38.5, 21.2 and 12.6 per cent. For a media plan this cuts both ways. AI companies are part of the reason some feed inventory got more expensive. They are also the first large advertiser category in years that behaves like a launch market rather than a maintenance market.
4. The channel map by surface, not by platform
| Surface | Share of measured ad revenue | Direction |
|---|---|---|
| Mobile | 89% | Core, still dominant |
| OTT and smart hardware | 9% | Gaining share from PC |
| PC | 2.1% | Shrinking |
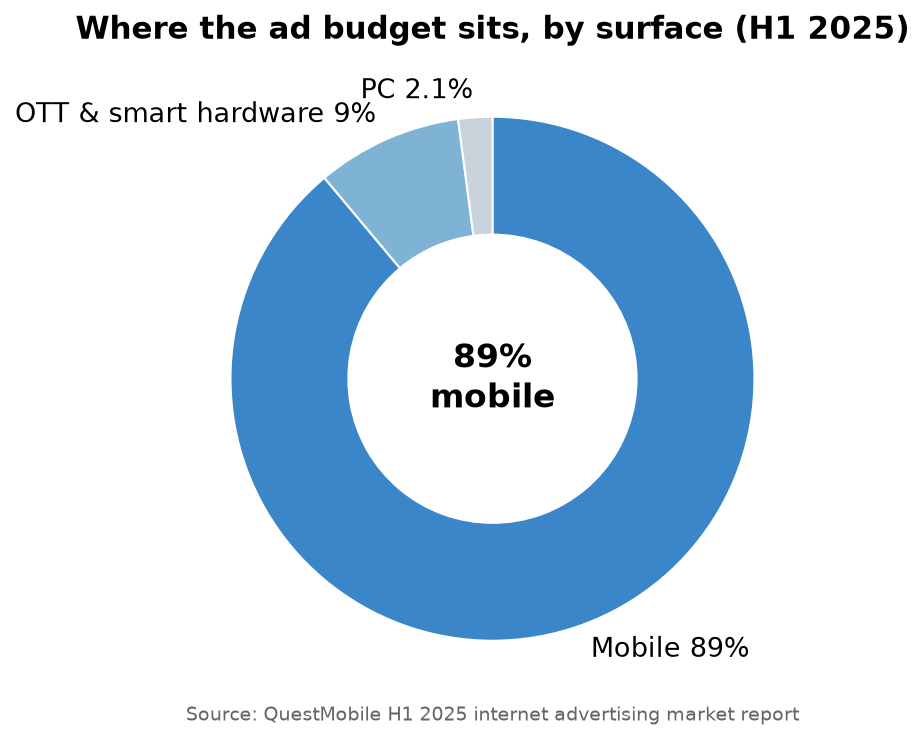
This is the cleanest split China publishes, because it is measured by device rather than by seller. The middle row is the one people skip. Nine per cent converts to roughly RMB71 billion a year spent on internet-connected television screens, in a market where household viewing never collapsed the way it did in the West. Connected screens remain a household entry point, and they keep absorbing budget that used to go to desktop.
One caveat before anyone builds a plan on this table. It covers hard advertising, the paid inventory that sits in a feed, a search result or a splash screen. It excludes soft advertising, meaning creator content and seeding work bought through agencies and key opinion leaders. That pool is large, separately measured and largely invisible in the numbers above. Treat the surface split as the paid-media layer, not the whole marketing economy.
5. Concentration: three sellers, half the money
| Seller | Category | Share of hard-ad revenue, H1 2025 |
|---|---|---|
| Taobao (Alibaba) | In-platform e-commerce | 22.5% |
| Douyin (ByteDance) | Short video | 19.1% |
| WeChat (Tencent) | Social | 10.8% |
| Top three combined | — | 52.4% |
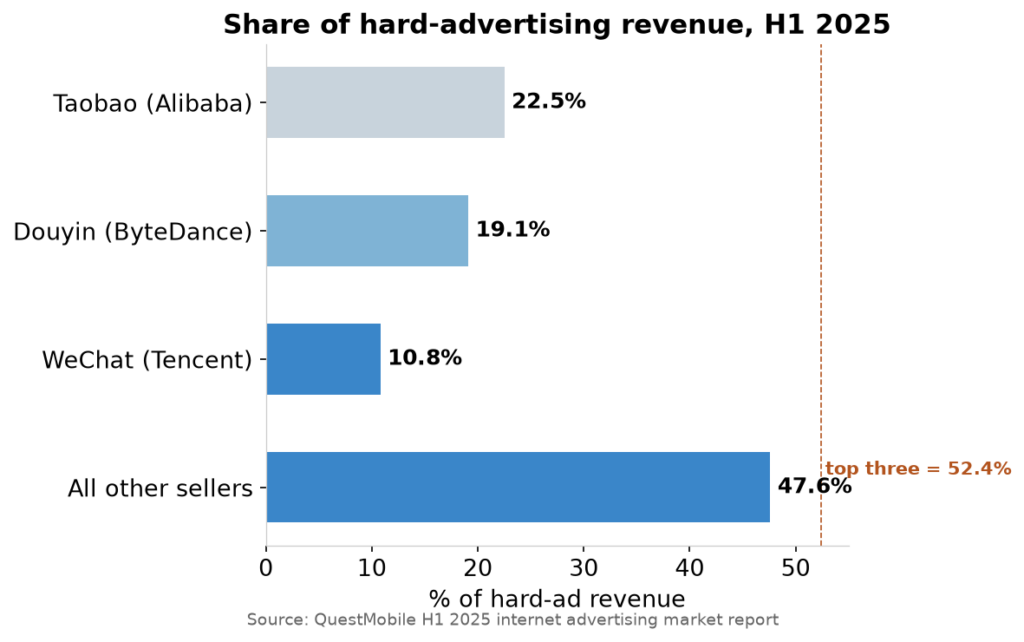
Concentration at this level is unusual for any market, and it produces the thing overseas buyers find strangest about China: there is no meaningful long tail of inventory. Below the top three, the sellers that matter number fewer than a dozen.
The practical consequence is negotiating power. A brand that wants reach in China does not assemble a portfolio of forty publishers with diminishing returns. It negotiates with three companies, each of which also owns the storefront, the wallet and, increasingly, the assistant. When your media partner is also your checkout and your discovery engine, the word “channel” stops describing anything useful.
6. The AI audience: 700 million users, three entrances, one behaviour change
China’s generative AI population passed 700 million by the first half of 2026, with penetration above 50 per cent, according to the China Internet Network Information Centre. The country counted 1.125 billion internet users in December 2025 on the same institution’s count, so more than three in five internet users now use generative AI, roughly three years after public launch.
What people do with it is more useful than the headline. In CNNIC’s 2026 survey, 76.0 per cent use generative AI to answer questions, 47.8 per cent to process images and video, 37.6 per cent to handle text, and 32.5 per cent for work summaries, meeting notes and presentations. Usage frequency for comprehensive assistants and office tools both grew more than 100 per cent year on year.
The distribution story is where marketing budgets should look.
| Entrance | Monthly users, September 2026 | Year on year |
|---|---|---|
| AI-native apps | 546 million | +82.1% |
| AI functions inside existing apps | 639 million | — |
| Phone-maker assistants | 783 million | +16.9% |
| Comprehensive AI assistants (all surfaces, overlapping) | 1.157 billion | +44.0% |
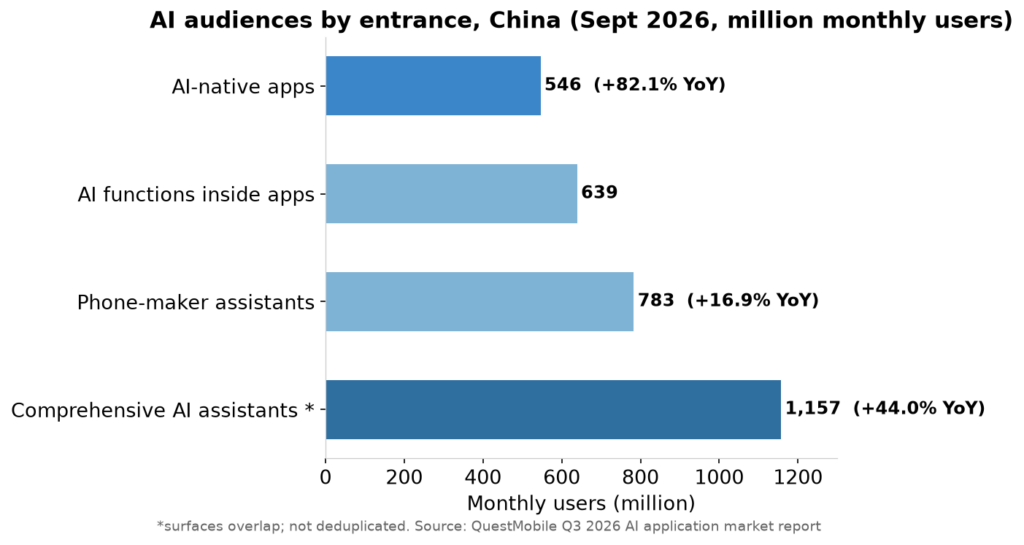
The three entrances do different jobs. AI-native apps capture ambiguous demand, the question you ask before you know what you want, and they are used 88.2 times a month for 173.5 minutes. In-app AI functions capture explicit demand inside a platform that already holds the payment relationship. Phone-maker assistants capture demand without being asked, through scene suggestions, which is why their reach is the largest and their engagement the least deliberate.
For a marketer, this matters because it splits “AI search” into three problems with three different solutions. Native apps reward entities and structured answers. In-app assistants reward catalogue completeness and merchant responsiveness. Device assistants reward whatever the operating system decides to surface, which no brand controls and every brand should monitor.
A fourth number points at where this goes next. AI office users reached 142 million, up 50.6 per cent, and agent-type office products grew more than 500 per cent on both app and desktop clients. The assistant is moving from answering questions to executing tasks. Once it books, buys and compares, it stops being a media environment and becomes a purchasing agent.
7. GEO: from grey tactic to auditable standard
Generative engine optimisation is the practice of making a brand legible to answer engines, so that it appears in generated responses rather than only in ranked links. In China it has spent two years in a grey zone between SEO, reputation management and manipulation.
On 14 October 2026 the China Advertising Association published three group standards, effective 23 October:
- Service requirements, covering provider qualifications, delivery process and the boundary between optimisation and interference.
- Effect monitoring and verification, standardising measurement dimensions, sampling rules and validation methods.
- Classification and selection of content sources, creating a graded model for the sources an answer engine draws on.
The middle standard is the one that matters commercially. GEO’s credibility problem has never been capability; it has been proof. Agencies sell visibility, clients ask for evidence, and both sides have been inventing their own measurement. A common sampling rule and a validation method turn the argument from anecdote into a contract term.
The third standard is the quiet one with the longest reach. If content sources are classified and graded, then the practical question for a brand becomes: which tier of source am I in, and what would it take to move up? That reorders budgets away from volume publishing and toward the kind of sources answer engines already prefer, meaning documentation, standards, statistics, institutional pages and clearly attributed reporting.
Three things follow for anyone building a China-facing GEO programme.
Structure beats volume. Answer engines extract sentences that stand alone. A paragraph that begins “Sales grew 8.9 per cent to USD1.3 trillion in 2026, according to WPP Media” is quotable. A paragraph that begins “In a world where consumers are increasingly…” is not. The unit of optimisation is the claim, not the article.
Entity clarity is infrastructure. A brand that appears under four name variants across platforms, with three different descriptions and no consistent category definition, gives the model nothing to attach to. Fixing that is unglamorous work with the highest return.
Verification beats optimism. Under the new standards, effect claims need a monitoring window, a sample and a baseline. Programmes that cannot produce those three will not survive procurement.
One number puts the size of that job on the page. Adobe’s Citation Readability Score estimates how well an AI system can understand and cite a site. In September 2026 the average US retail homepage scored 63 per cent, which means more than a third of homepage content is effectively invisible to answer engines. The content types that move the score are the unglamorous ones: product details, buying guides, FAQ pages and return policies. That list doubles as the short version of this entire section.
8. Platform deep dives
Douyin: the floor and the auction
Douyin is no longer a channel decision. With 1.009 billion monthly and 712 million daily users, it is the surface on which Chinese consumer attention sits. Its 19.1 per cent share of hard-ad revenue makes it the second-largest seller in the country, behind only Taobao.
The mechanic to understand is that the auction rewards creative volume. A brand arriving with one polished film competes against sellers shipping daily. That is why Chinese creative production has industrialised: not because brands love content, but because the auction prices freshness.
The 2026 correction is what happens after the stream. During the first four days of the Double 11 period, merchants whose store-run livestreams passed RMB10 million in sales rose 133 per cent year on year, those crossing the same threshold on product cards rose 103 per cent, and merchants whose search-driven sales passed RMB1 million rose 111 per cent. Product cards and search are where the customer who watched last week buys this week. Brands that fund only the top of that journey pay twice for the same buyer.
Xiaohongshu: 400 million and 245 million, and why both are true
Two numbers circulate for Xiaohongshu and they differ by 155 million.
The company’s own figure, reported through Chinese business media in July 2026, is over 400 million monthly users, daily users between 135 and 170 million, 800 million searches a day and 16 app opens per user per day. That count covers a network of surfaces: the app, the web, mini programs and a television and desktop push.
QuestMobile’s panel counts the app alone: 245 million monthly users in March 2026, down 1 per cent year on year, the first decline in six years of tracking, with daily users up 3 per cent and time per user down 4 per cent.
Read together, the shape is clear. The surface is wider than the app, the app has stopped growing, and the habit has not, because the searches keep rising to 800 million a day.
That is the strategic point. A platform whose users run 800 million searches a day is not a social network with a shopping tab. It is a decision engine with a feed attached, which is why it sits at the consideration stage rather than at awareness or checkout. Its commercial tension is equally clear: the more it monetises the feed, the more it erodes the trust that makes the search worth running.
WeChat: the operating system that happens to sell ads
WeChat reached 1.281 billion deduplicated users, flat year on year. Flat is the correct word and the correct expectation. There is no growth left in reach; there is only depth per user.
Its advertising share, 10.8 per cent of hard-ad revenue, understates its role, because WeChat’s value is not impression inventory. It is the layer where a customer relationship persists after the campaign ends: mini programs for transactions, official accounts for service, private channels for retention, and now AI functions embedded in the app ecosystem reaching 639 million monthly users.
For a foreign brand the lesson is structural. In Western markets a brand owns a database; in China it rents a relationship inside someone else’s operating system. Budgets for retention, service and member operations therefore sit closer to media than they do elsewhere, and the team that runs them is usually not the media team.
AI assistants: the new front door
Doubao reached 419 million monthly users, Qwen 158 million and DeepSeek 123 million in September 2026. These are not search engines with a chat interface. In CNNIC’s survey, 76 per cent of users go to generative AI to answer questions, and the fastest-growing use cases are shopping support, comparison and task execution.
Policy has moved in the same direction. In October 2026 nine government departments issued 18 measures to apply AI across commerce, explicitly encouraging commercial AI agents for shopping assistance, operations and logistics. When the state writes shopping agents into industrial policy, the assistant stops being an experiment and becomes distribution.
The marketing consequence is a shift in what gets optimised. In a feed, you optimise creative. In a search box, you optimise keywords and landing pages. In an assistant, you optimise the facts the model can retrieve: specification, price band, warranty, availability, comparison logic. Brands with clean, structured, third-party-corroborated product facts get recommended. Brands with beautiful campaigns and ambiguous specifications do not.
9. Live commerce: the lane narrowed, the traffic did not stop
Live commerce is often described as China’s highest-velocity conversion channel. Half of that survives contact with the data.
The mechanism is real: attention, demonstration, price and payment inside one screen, so the leakage between steps disappears. That is why the format survived the departure of its biggest stars and why it survives the arrival of synthetic ones.
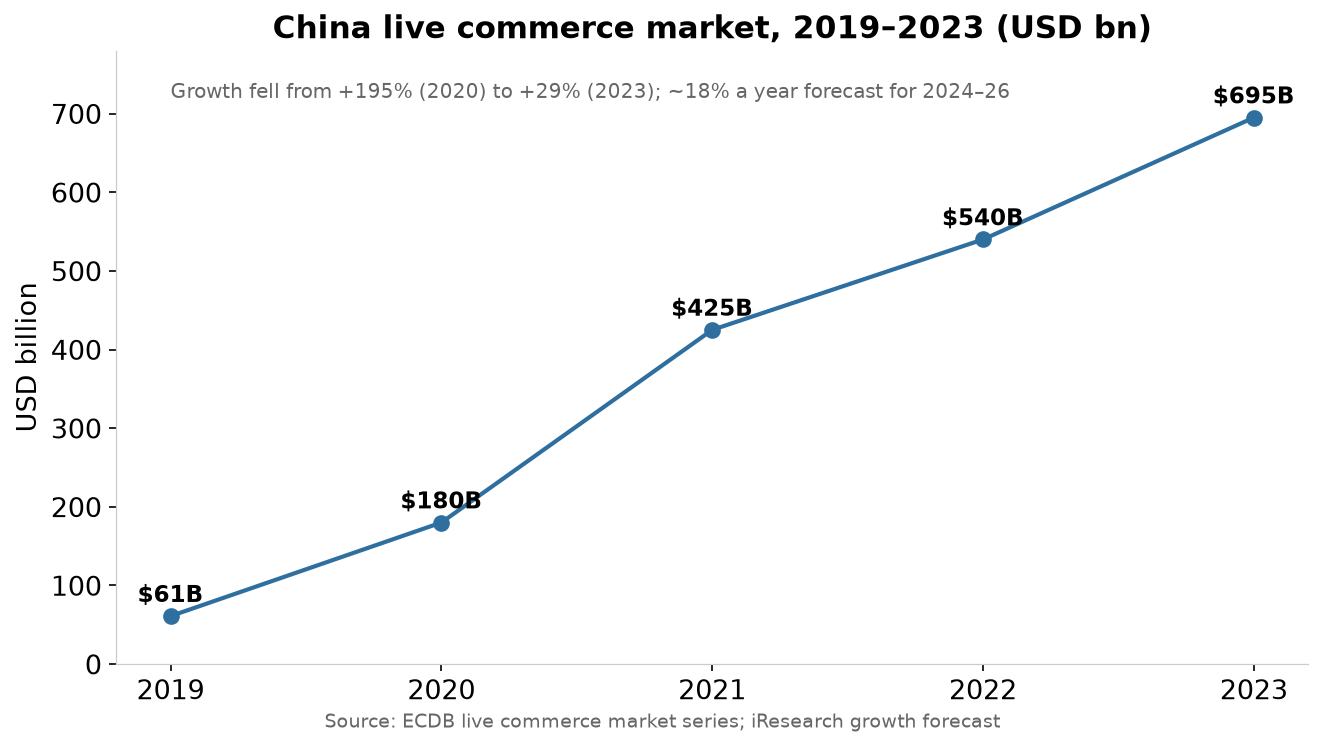
The growth is another matter. China’s live commerce market went from USD61 billion in 2019 to USD180 billion in 2020, USD425 billion in 2021, USD540 billion in 2022 and USD695 billion in 2023, on ECDB’s series. Annual growth fell from triple digits to the twenties and then the high teens. iResearch expects roughly 18 per cent a year across 2024 to 2026.
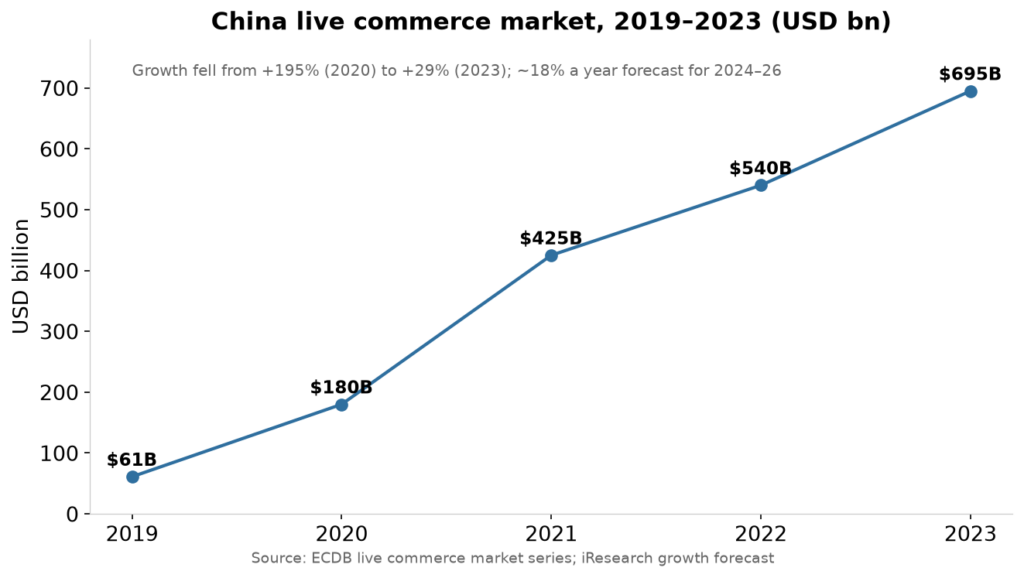
Anchor that against online retail of RMB15.97 trillion in 2025, the thirteenth consecutive year China ranked first globally on that measure, and live commerce is no longer a novelty riding on a base. It is one of the load-bearing beams.
Inside the channel, the camera changed hands. During the 618 window in June 2026, digital-human hosts sold RMB45.1 billion across five major platforms, up 186 per cent, with more than 300,000 merchants running a synthetic presenter and more than 70 per cent of leading stores putting one on camera. The economics explain the adoption: one major platform estimates AI hosting cuts operating cost by 80 to 90 per cent, and subscription pricing for standard digital humans sits in the hundreds to low thousands of yuan a month, against a human anchor, co-host, camera operator and overnight shift premium.
The honest reading is coverage, not replacement. A synthetic presenter holds the hours nobody wants to staff, repeats standardised explanation without drift, and answers the same question forty times an hour. It cannot take responsibility for an answer, which is what a shopper asking about sizing is actually requesting, and it cannot handle the exceptions where repeat purchase is won.
Two corrections arrived in the same year. Platforms tightened rules, banning fully AI-generated livestreams on Douyin while requiring disclosure whenever a digital host appears. And the discount engine ran out of fuel: Citi’s October 2026 note on the season describes platforms moving from bundle arithmetic to direct price cuts, partly to curb fake order inflation and partly to bring return rates down, with total Double 11 GMV growth expected in the low-to-mid single digits.
10. The global benchmark: a bigger market growing faster
| Metric, 2026 | Value | Source |
|---|---|---|
| Global ad spend | USD1.34 trillion, +11.9% | WARC, Q3 2026 |
| Global ad revenue (alternative forecast) | USD1.30 trillion, +8.9% | WPP Media, midyear 2026 |
| Social media | USD394.6 billion, +21.3% | WARC |
| Search | USD295.7 billion, +14.2% | WARC |
| Retail media | USD202.1 billion, +14.3% | WARC |
| Social, search and retail combined | 66.4% of global spend | WARC |
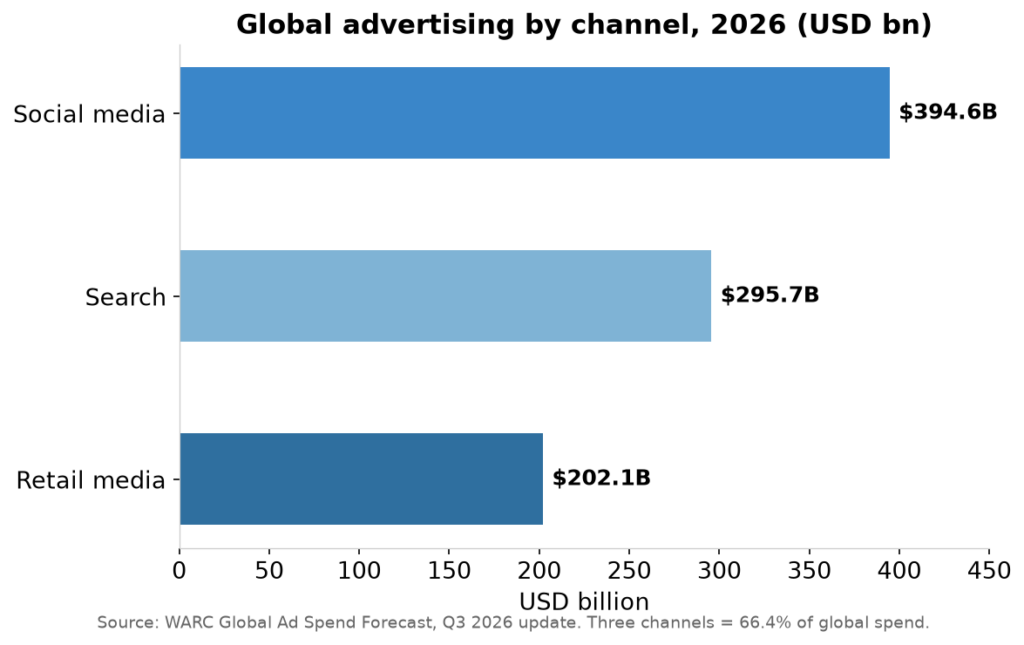
The two headline forecasts differ by about USD40 billion, which is worth explaining rather than averaging. WARC revised upward through 2026 on the strength of AI-company spending and a heavy events calendar. WPP Media’s midyear number is lower on both total and growth, and treats generative search as a separate line. Use WARC for channel splits, WPP Media for the search-to-answer migration argument, and never blend them into one chart without saying so.
Three structural facts sit inside the global total. Social is the largest single channel and the fastest-growing at scale. Retail media, at USD202 billion, is now the foundation commerce advertising is built on. And the three largest sellers, Alphabet, Amazon and Meta, take 59.7 per cent of global spend excluding China, or USD659.6 billion, rising to 61.5 per cent by 2028.
China’s absence from that concentration figure is the point. The global market concentrates around three American companies; the Chinese market concentrates around three Chinese ones. Almost nothing crosses the boundary, which is why “global media plan” and “China media plan” remain two documents.
AI referral traffic is small, growing fast and worth more per visit. Adobe Analytics measured AI-referred traffic to US retail sites up 71 per cent year on year in September 2026, and forecasts a 130 per cent increase across the 2026 holiday season. The quality of that traffic is the striking part: AI-referred visitors generated 83 per cent higher revenue per visit and converted 90 per cent better than visitors from other channels in September. Adobe’s holiday-only forecast puts US online spending at a record USD275.1 billion for 2026, up 6.7 per cent. In its survey of 5,000 consumers, 77 per cent of those who had used AI for shopping said it made them more confident in a purchase, and 69 per cent said they were less likely to return an item.
The volumes are still modest enough that nobody should rebuild a plan around them. The direction is consistent across every independent source, and the quality gap is the part that matters: fewer visits, better buyers.
11. The measurement gap is now the binding constraint
Every number in this report comes with a caveat, and the caveats stack up into a single problem. Attribution in China is not broken because the tools are bad. It is broken because the journey moved somewhere clicks do not reach.
Three specific breaks:
Walled gardens price their own inventory. When three sellers hold half the market, there is no independent currency. Each platform reports its own conversions on its own attribution window, and the overlaps are resolved by whoever is reporting.
AI referral behaves like dark social. An assistant that recommends a brand without a link produces a sale with no referrer. The purchase is visible in the storefront; the cause is invisible in analytics. Adobe’s finding that AI traffic converts better only helps if you can identify it, and much of it arrives unattributed.
Agentic purchase removes the session. When a shopping agent completes a transaction, there may be no page view, no cookie and no journey to model. The media plan optimises a funnel that the buyer never entered.
The organisational version of the same problem shows up in survey data. In Adobe’s 2026 global study, 84 per cent of organisations missed at least one marketing opportunity in a quarter because a workflow could not respond in time, 29 per cent missed six or more, and only 7 per cent had embedded AI in a way that produced measurable business results. Gartner’s CMO research through 2026 keeps finding the same shape: AI sits at the top of priority lists and well below that on budget lines.
The pattern is consistent across markets and flattering to nobody. Adoption is not the constraint. Orchestration is.
12. Outlook for 2027: five calls, and what would prove them wrong
1. China’s measured ad market grows 5 to 6 per cent. Base case RMB885 billion. Wrong if consumption stimulus outpaces expectations or if platform ad load rises faster than forecast.
2. Brand budget holds above 20 per cent of hard-ad spend. The 2026 reversal was structural, not seasonal, because it was driven by inventory scarcity rather than sentiment. Wrong if a price war returns cheap performance inventory to the market.
3. AI-native app growth decelerates from 82 per cent to 30 to 40 per cent. A 546 million base cannot triple again. Growth shifts to frequency and commerce, not users. Wrong if a new device category, whether glasses, in-car systems or robotics, resets the base.
4. GEO budgets consolidate into measurement contracts. The October standards give procurement a document to buy against. Expect fewer, larger, audited engagements and the disappearance of visibility-only pitches. Wrong if enforcement stays light and buyers keep accepting screenshots as evidence.
5. Live commerce settles into high-single to low-teens growth, with synthetic hosts as default staffing. Wrong if platforms reverse their restrictions on AI-generated streams, which would reopen a cost advantage faster than expected.
One call deliberately omitted: nobody should forecast the share of purchases made by agents in 2027. The transaction data does not exist yet, and every published estimate is a vendor projection wearing a decimal point.
13. What to do, by role
If you are a global brand entering China
Build the measurement spine before the media plan. Pick one attribution standard, accept that it will be imperfect, and hold it for four quarters so that comparisons mean something. Then buy reach where reach is cheap (short video), consideration where intent is expressed (lifestyle search), and retention where the relationship can persist (WeChat). Do not treat these as three campaigns. They are one journey with three settlement points.
Budget for creative volume you cannot fully control. The auction prices freshness, so a plan with twelve assets a year will lose to a competitor shipping twelve a week, regardless of production quality.
If you are a Chinese brand going global
Your advantage is operating discipline learned in a harder market: fast iteration, live selling, creator supply chains, agent-assisted service. Your disadvantage is that none of it transfers automatically. Global platforms do not concentrate the way Chinese ones do, so reach must be assembled rather than bought, and privacy rules remove the cross-platform visibility you are used to.
Take GEO seriously earlier than your competitors. Answer engines are the one distribution layer where a smaller brand with clean facts can outrank a larger brand with a bigger budget.
If you are an agency
Sell verification, not visibility. The standards published in October are a commercial opening for anyone willing to be audited. The firms that lose the next two years are the ones still selling rankings in an environment that no longer has a page one.
What to stop doing
Stop quoting triple-digit live commerce growth, which belongs to 2020. Stop treating AI adoption as a KPI; it is an input. Stop building China plans on global benchmarks without adjusting for concentration, and stop promising cross-platform attribution that the architecture cannot deliver.
14. How to read these numbers
Four instrument types appear in this report, and they do not substitute for each other.
Government census. CNNIC counts users by application on a national sample. It is the only series that covers the whole country on one definition. It is slow and coarse.
Third-party panel. QuestMobile measures app activity across a device panel. It is fast and granular, it sees apps better than it sees messaging, and it is an estimate rather than an audit.
Platform disclosure. Douyin, Xiaohongshu and Alibaba publish selected operating metrics, usually at conferences. Directional, and chosen by the seller.
Forecast house. WARC, WPP Media and iResearch model markets from a mix of disclosed revenue and panel data. Their totals differ by methodology, which is why this report shows both rather than averaging.
Any sentence that mixes these without saying which is which will be quoted out of context. That is not a warning about other people’s work. It is a warning about your own deck.
15. Summary
China’s digital marketing market in 2026 is large, slow-growing and unusually concentrated. Measured internet advertising will land near RMB836 billion, up about 5 per cent, in an economy where retail sales grew 1.1 per cent. Three platforms take half the hard-ad money. Short video took the increment, search lost share but kept its revenue, and brand budget returned for the first time in a decade.
The AI layer is no longer experimental. Seven hundred million people use generative AI, 546 million use AI-native apps monthly, and 1.16 billion touch an assistant across apps and devices. The assistant has become a distribution channel with its own optimisation logic, and China has just written the first standards for that logic.
What limits performance is not access to tools or audiences. It is the ability to prove what worked, in a market where the journey now runs through walls, assistants and agents. The brands that win the next planning cycle will be the ones that treat measurement as production infrastructure rather than as a reporting afterthought.
Frequently asked questions
Is China’s advertising market still growing?
Yes, at roughly 5 per cent a year in nominal terms. The measured internet advertising market reached RMB793.1 billion in 2025 and is forecast at RMB836.3 billion for 2026. The growth is real but modest: no full year since 2023 has grown faster than 6.1 per cent. Anyone describing this market as explosive is using the regulator’s wider count, which grew 32.6 per cent in 2025 largely because the reporting base widened.
How large is China’s AI audience, exactly?
It depends on the denominator, and three answers are all correct. More than 700 million people used generative AI by mid-2026 on CNNIC’s national count. AI-native apps reached 546 million monthly users in September 2026 on QuestMobile’s panel. Counting assistants embedded in super apps and phone systems, 1.157 billion people touch a comprehensive AI assistant each month, though those surfaces overlap and the figure is not deduplicated. Use the first for national context, the second for app competition, the third for reach planning.
Does generative engine optimisation actually work?
It works in the narrow sense that answer engines retrieve and cite sources, and sources can be made more retrievable: clearer entities, standalone claims, structured specifications, third-party corroboration. It does not work in the sense most pitches imply, because visibility varies by question, by model and by week. The October 2026 group standards address exactly this by fixing sampling rules and validation methods, which converts an unfalsifiable claim into a measurable one.
Is live commerce in decline?
No. Growth fell from triple digits in 2020 to roughly 18 per cent a year across 2024 to 2026, and the lane is narrower than it was. But the format is load-bearing inside RMB15.97 trillion of annual online retail, digital-human hosting has industrialised the long tail of hours, and store-run broadcasts are growing faster than star-led ones. Normalisation is not decline. It is the point at which the channel has to earn its budget like any other.
Can global benchmarks be applied to China?
Partly. Channel economics transfer: social is the growth engine globally and in China, retail media is the commerce foundation in both, and search is losing share to answers in both. Market structure does not transfer: China’s three-seller concentration, super-app commerce and private-domain operations have no Western equivalent. Use global benchmarks for direction and Chinese panels for sizing, and never substitute one for the other.