Marketing Attribution Is Broken — Here’s How to Measure Anyway
Executive summary
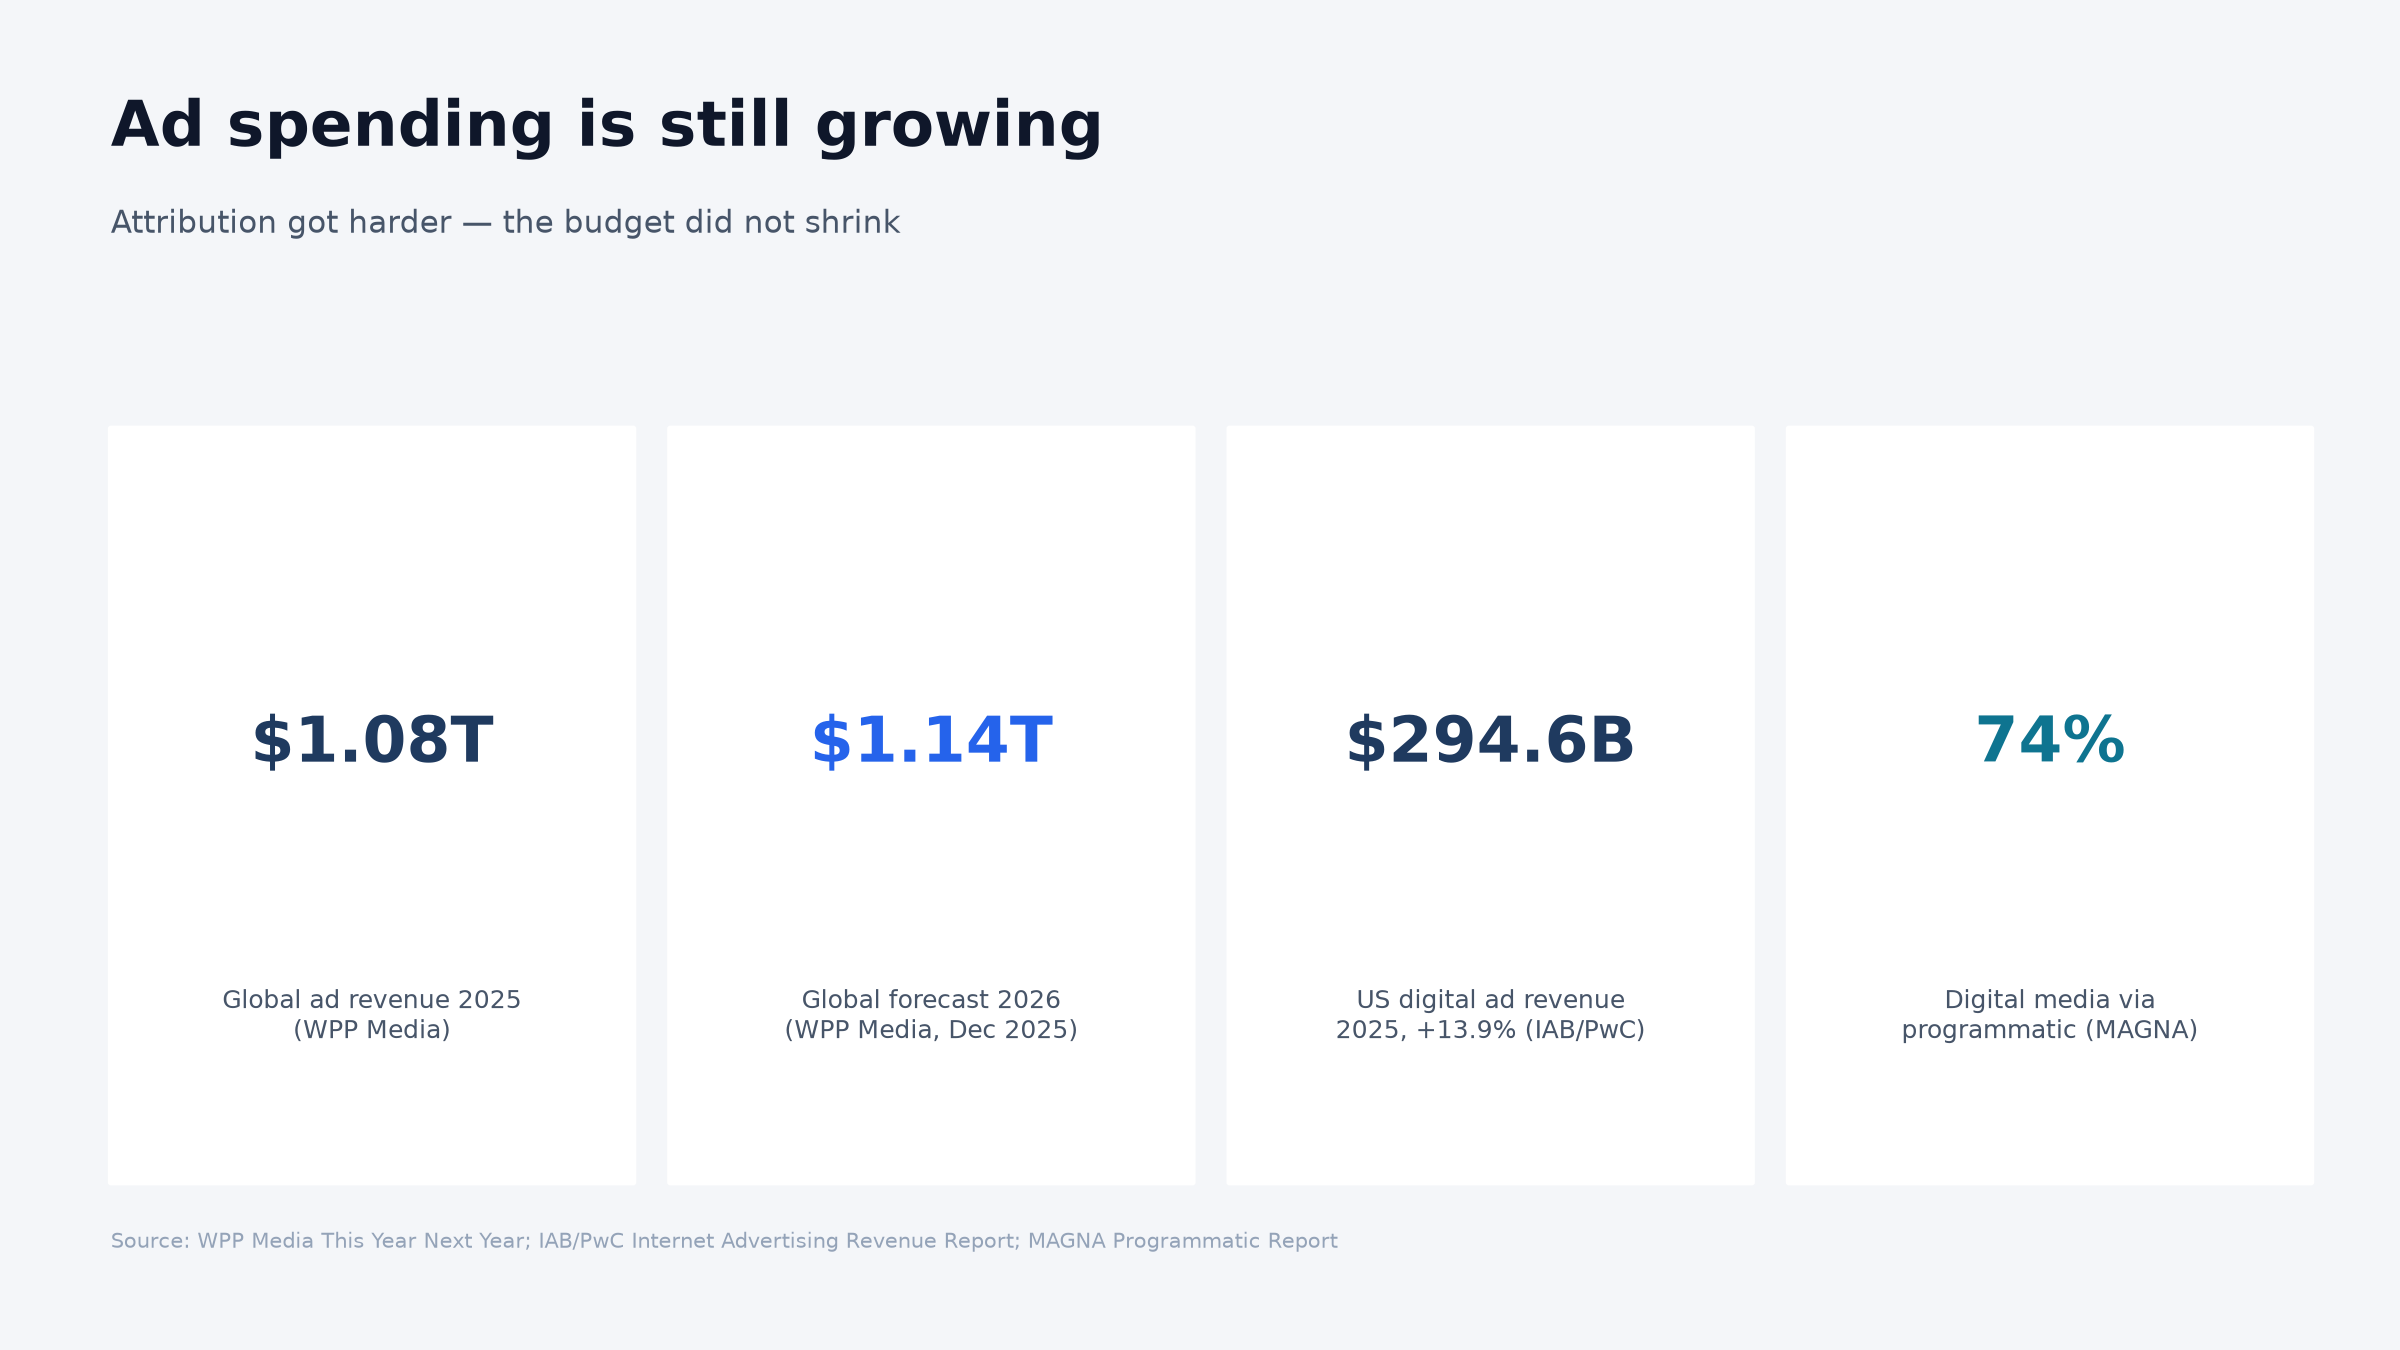
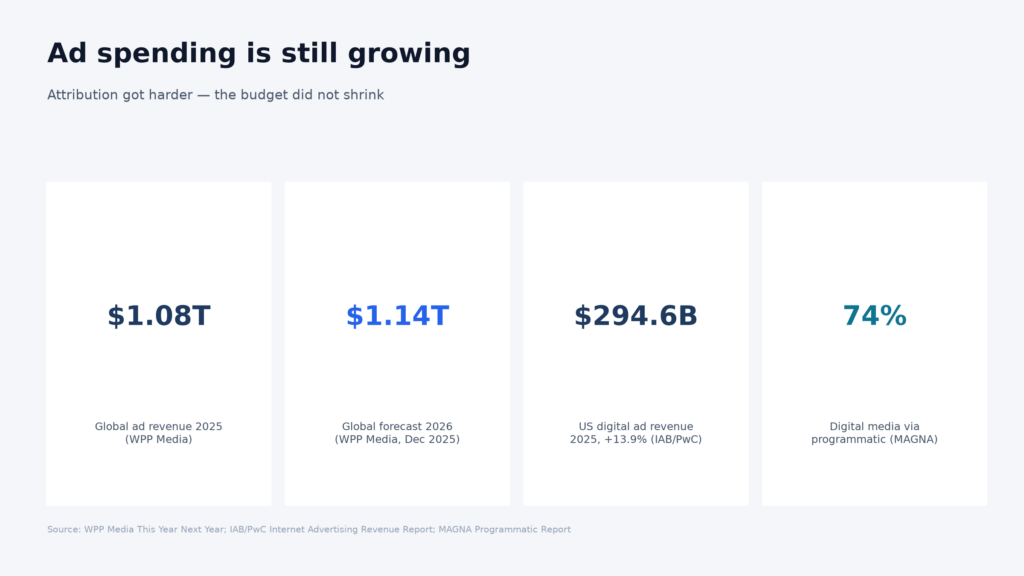
Marketing attribution is the practice of deciding which touchpoints earned a sale, and therefore which ones keep getting funded. In 2026 that job looks nothing like the version most slide decks still describe. Google retired most of the Privacy Sandbox on 17 October 2025, including the Attribution Reporting API that was meant to measure conversions without cookies, and left third-party cookies running in Chrome. Google Analytics 4 now offers three attribution models, not five. The money kept growing anyway: IAB and PwC measured USD 294.6 billion of US digital advertising revenue in 2025, up 13.9 percent year on year, and WPP Media forecast USD 1.14 trillion globally for 2026, up from USD 1.08 trillion in 2025. More money, narrower tools. The workable answer is to run three cheap and independent estimates of the same number, then manage the disagreement between them instead of pretending it away.
1. The most quoted line in advertising has a thin paper trail
“Half the money I spend on advertising is wasted; the trouble is I don’t know which half.”
You have seen it a hundred times. It usually gets credited to John Wanamaker, the Philadelphia department-store owner, and the sourcing behind that credit is weaker than almost anyone quoting it realises.
Which is fitting. The industry’s founding complaint about measurement is itself badly attributed.
The complaint has aged, though. A century ago the waste was genuinely invisible. Today it is visible enough to argue about, and the argument is the problem. Your ad platform reports one number, your analytics tool reports another, your finance lead reports a third. You are not blind anymore. You are over-exposed, staring at four dashboards that refuse to agree.
2. Three changes that reset the problem this year
2.1 The cookies did not die. The replacement did.
For four years the accepted story was that third-party cookies would disappear and privacy-preserving APIs would take over measurement. On 17 October 2025 Google announced it was retiring most of those APIs instead, and third-party cookies would stay in Chrome.
A longitudinal study published on arXiv in 2026 measured what happened across the top 10,000 websites. The finding was uncomfortable: adoption had stalled well before the announcement. Most APIs were touched by only a handful of actors, and even the ones Google planned to keep showed no growth. By January 2026 the retired measurement APIs were still appearing on between 19 and 27 percent of the crawled sites, which sounds reassuring until you notice that this is residue from integrations nobody bothered to remove, not fresh adoption. The single exception was CHIPS, the mechanism that partitions cookies by top-level site. Not the measurement APIs. The unglamorous plumbing.
So what does the average advertiser actually have in 2026? Cookies that still work, shrinking in reach as Safari and Firefox block them and as consent screens trim the addressable pool. First-party identity where the customer logs in. And a modelled gap in the middle that some vendor is always happy to fill for a fee.
2.2 AI search stopped being a side channel
WPP Media’s June 2026 forecast projects that traditional search and generative search together will account for 21.8 percent of total advertising revenue in 2026. That is not a rounding error.
It matters for attribution for one reason. An AI answer frequently produces no click. Someone asks a question, reads a synthesised recommendation, then buys later through a branded search or a direct visit. The influence existed. The session did not. Nothing in your last-click report will ever see it.
2.3 China wrote a standard for the part nobody could measure
On 14 October 2026, the China Advertising Association published three group standards for generative engine optimisation, effective 23 October. One of them covers monitoring and verifying GEO effect, with unified measurement dimensions, sampling rules and verification methods. The stated purpose is to break the industry’s long-standing problem of inconsistent evaluation and unverifiable results.
Read that again. A national industry body standardised how to verify performance inside AI answers while most Western measurement teams are still debating whether that channel should count as media at all.
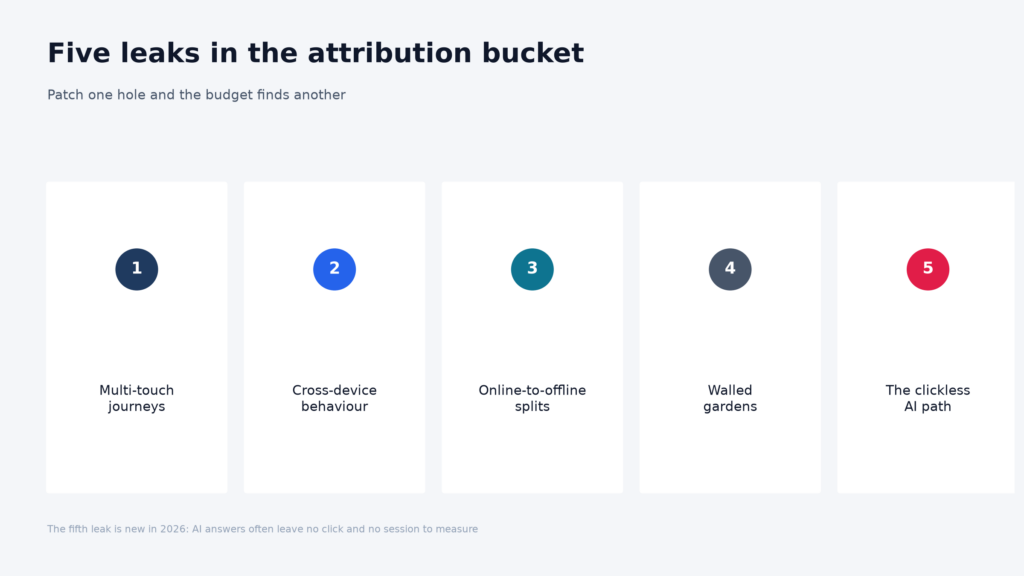
3. Why this is hard: five leaks, not four
The standard explanation lists four problems. Multi-touch journeys spread credit across many interactions. Cross-device behaviour breaks the chain between the phone and the laptop. Online-to-offline splits lose the purchase entirely. Walled gardens refuse to share user-level data with anyone.
All true. All familiar. And all four are now joined by a fifth.
The clickless path. Consider how discovery works in 2026. A person asks an assistant for a recommendation, watches a creator’s video, walks past a storefront, then searches for your brand by name. Three of those four touchpoints leave either no click or no identifiable session. Attribution never claimed to model this well. It used to at least have a click to hang the story on. Increasingly it does not.
Here is the useful mental model. Attribution is a bucket with five holes. Plug one and the water finds another. The mistake is believing a bigger bucket solves it. It does not. You need more than one bucket, and you need to know which one is leaking when the totals disagree.
4. The five-model slide is out of date
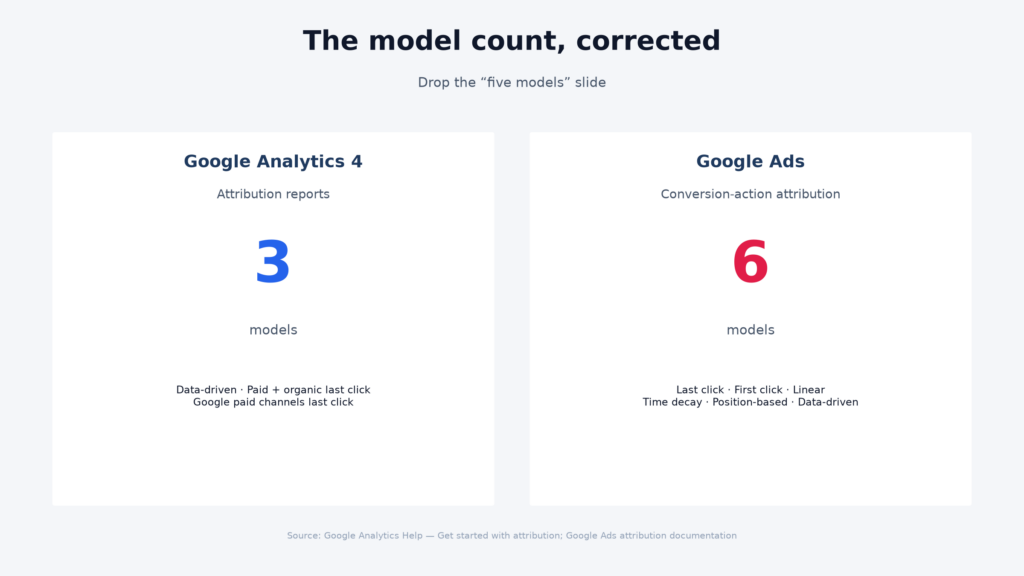
If your deck still shows “five attribution models,” it is describing a product that no longer exists in that form.
Google Analytics 4’s Attribution reports offer exactly three: data-driven attribution, paid and organic last click, and Google paid channels last click. First-click, linear, time decay and position-based are not there. They were removed as GA4 consolidated around data-driven attribution.
Google Ads is a different product and still lets you choose from six attribution models for conversion actions: last click, first click, linear, time decay, position-based, and data-driven.
Two products, two answers, and a lot of decks that quietly blend them. That blend is where most bad attribution advice comes from. It is also why the common recommendation to “upgrade from last-click to linear” is now a dead end. In GA4, there is no linear model to upgrade to.
| Model | What it does | Where it still lives | When it misleads you |
|---|---|---|---|
| Last click | Gives all credit to the final interaction | GA4, Google Ads, most platforms | Branded search and retargeting steal credit from upper-funnel work |
| First click | Credits the first interaction | Google Ads only | Overvalues discovery, ignores closing |
| Linear | Splits credit evenly | Google Ads only | Treats a ten-second impression like a demo request |
| Time decay | Weights recent interactions more | Google Ads only | Punishes long consideration cycles |
| Position-based | Heavy weight on first and last | Google Ads only | Arbitrary 40/20/40 split presented as analysis |
| Data-driven | Allocates credit from your own conversion data | GA4 and Google Ads | Only sees what the platform can see |
5. Rule-based models are not obsolete. They are diagnostic.
Last-click is not a moral failure, and treating it like one wastes a useful instrument.
Last-click is your lower bound. It is the number your finance team can reconcile and sign off, and there is real value in a number nobody has to argue about the methodology of.
First-click tells you where discovery happens. Linear tells you how wide the journey is. Time decay tells you how long the tail runs. Position-based tells you about the two ends. None of these is true. All of them are readable, and readability earns its place.
Use them the way a mechanic uses a stethoscope. Not as a diagnosis, as a pointer to where to look.
6. What machine learning actually improves
Less than the vendor decks suggest. Two things, precisely.
First, it makes credit assignment depend on your own conversion data rather than a fixed rule. Google’s own documentation is explicit that data-driven attribution uses machine learning to weigh both converting and non-converting paths, and that the model is specific to each advertiser and each key event. That is a genuine improvement over a 40/20/40 guess.
Second, it can tell you how confident it is. A 2026 paper presented at the CIBDA conference, on uncertainty-aware marketing attribution inference and budget decisions, argues that point estimates hide the risk that matters for planning. Work published at WSDM 2024 goes further with CausalMMM, which learns causal structure for marketing mix modelling rather than fitting correlations. An IEEE Transactions on Engineering Management primer from 2024 reaches a similar practical conclusion about out-of-the-box AI mix models: they are useful, and they are not self-validating.
Here is the limit that no paper fixes. Data-driven attribution runs inside one platform’s view of the world. It cannot assign credit to a channel it never observed, and it will never tell you that its own reported conversions were partly organic.
7. MMM came back, and this time it is open source
Marketing mix modelling spent a decade as the expensive thing big advertisers did with a consultancy. It is now the default answer to cookie loss, for one structural reason: MMM works on aggregate data, not user-level data. Privacy regulation cannot take away what was never personal.
The barrier to entry also fell. Google publishes Meridian, an Apache-licensed, open-source MMM framework, so advertisers can run in-house models rather than rent them. A companion tool, GeoX, runs geo experiments to calibrate the model, which addresses the oldest criticism of MMM, namely that it produces beautiful coefficients nobody has tested.
The trade-offs are unchanged and worth stating plainly. MMM needs weeks of clean spend data, it works at channel level rather than campaign level, and it cannot see creative quality at all. It is also slow. That is acceptable, because budget decisions are slow too.
8. Incrementality is the only ground truth you will ever get
Every model in this article is an estimate. An incrementality test is an experiment. That difference is not academic, it is the difference between a story and evidence.
Three formats cover most needs. A geo holdout switches a channel off in matched regions and compares the difference. A PSA test shows a placebo ad to a control group and measures the lift above it. A switchback alternates on and off in time, which suits channels where holdouts are impractical.
The costs are real: weeks of runtime, enough volume for statistical power, and someone senior willing to accept a result that contradicts the platform’s dashboard. The payoff is a number no vendor can dispute, because you generated it yourself.
Run one per quarter. Not more, not less. One tested channel per quarter compounds faster than ten modelled channels.
9. China runs a different measurement stack
Western attribution problems and Chinese attribution problems are not the same problem wearing different clothes. One is fragmentation. The other is concentration.
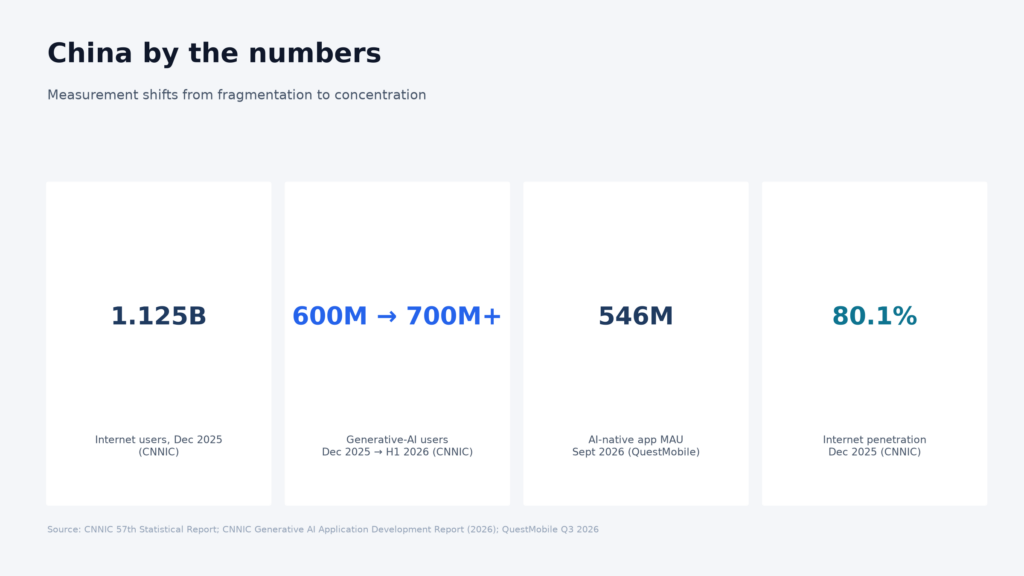
Start with scale. CNNIC’s 57th statistical report, published in February 2026, put China’s internet users at 1.125 billion as of December 2025, with 80.1 percent internet penetration, and generative AI users at 602 million, up 141.7 percent year on year and reaching 42.8 percent penetration. By the first half of 2026, its October report recorded generative AI users past 700 million and penetration above 50 percent. QuestMobile separately counted 546 million monthly active users of AI-native apps in September 2026, up 82.1 percent year on year.
Now the structural part. Much of Chinese commerce happens inside closed loops. A purchase can begin, be influenced and complete inside one super-app, with payment attached. Cross-site leakage is smaller than in the West. Platform dependency is larger. If WeChat, Douyin or Alibaba decides what its attribution panel shows you, no cookie policy will rescue your number.
Two consequences follow, and they are worth internalising.
First, the funnel is shorter, so the multi-touch problem is smaller and the platform-trust problem is bigger. Western teams fight for identity resolution across sites. Chinese teams fight for audit rights inside someone else’s app.
Second, the newest battleground is the same on both sides. QuestMobile’s autumn 2026 ecosystem report describes a shift toward intent-anchored, cross-device continuity and cross-scenario delivery, where the journey is stitched by intent rather than by session. That is exactly the clickless path from section three, arriving in the market with 700 million AI users.
The China Advertising Association standards are the institutional response. Whatever you think of standardised GEO verification, it beats the alternative most Western brands currently run, which is asking a tool vendor to grade its own homework.
10. A starter plan for a team of one
Most attribution advice assumes a data team. Assume you do not have one.
Step one: pick two sources and stop. One analytics platform and one ad platform you actually spend money in. Two sources that disagree is information. Five sources that disagree is a monthly meeting that produces nothing.
Step two: keep data-driven attribution switched on for direction. It is better than last-click in GA4 by default, and it costs you nothing to leave it running. Read it as a trend line, never as a ledger.
Step three: reconcile monthly, not daily. Pick one number, usually total conversions, and track the gap between the two sources over time. A stable gap is fine. A gap that suddenly doubles is a tracking bug, and catching those early is worth more than any model upgrade.
Step four: one incrementality test per quarter. Choose the channel you are most suspicious of. If the test shows less lift than the platform claimed, you have found budget.
Step five: build MMM only when spend justifies it. As a rule of thumb, if your monthly media spend is below the cost of a junior analyst, MMM is not for you yet. Geo tests are cheaper and answer narrower questions better.
Step six: write your assumptions down. One paragraph, dated, listing what you believe about channel roles. Half of all attribution disputes are two people using the same word to mean different things.
11. Five things to stop doing
Stop reporting platform ROAS as truth. It is a platform’s opinion of its own contribution, computed on data it chose to keep.
Stop reconciling to the penny. Two systems will never match, because they count different things at different times. Track the gap, not the difference.
Stop migrating attribution vendors every eighteen months. Most migrations move the problem, not the answer.
Stop treating last-click as a character flaw. It is a lower bound with a clean audit trail, and plenty of finance directors sleep better because of it.
Stop building the perfect model before running one honest test. The test is cheaper and it is right more often.
12. Conclusion
Attribution in 2026 is not a modelling problem waiting for better maths. The maths got better and the problem got worse, because the journey moved somewhere models cannot follow.
What actually changed is where the evidence lives. It no longer lives in a click stream. It lives in aggregate patterns, in deliberate experiments, and increasingly in a conversation with an assistant that logs nothing you can audit.
So build for disagreement. Keep three estimates of the same number: a modelled view, a platform view and a tested view. When they converge, spend with confidence. When they diverge, investigate before you scale. And accept the part nobody has solved, including the organisations now writing standards about it.
Half your budget probably still is wasted. The improvement available to you is not knowing exactly which half. It is knowing which of your three buckets is leaking this quarter.
Before you go
If you want the short version in working form, there is a one-page attribution starter checklist: the two sources worth connecting first, the three questions to ask your platform rep before renewing anything, and the single test that tells you whether a channel is actually earning its budget. Ask for it and we will send it across.
Frequently asked questions
How many attribution models does Google Analytics 4 actually offer in 2026?
Three: data-driven attribution, paid and organic last click, and Google paid channels last click. The first-click, linear, time decay and position-based models that appear in older guides are no longer available in GA4’s Attribution reports. They remain selectable in Google Ads for conversion actions, which is why so much published advice is confused.
Did Google actually kill third-party cookies?
No. Google abandoned its plan to remove third-party cookies from Chrome and, on 17 October 2025, retired most of the Privacy Sandbox APIs it had built as replacements, including the Attribution Reporting API. A 2026 arXiv study of the top 10,000 websites found adoption had stalled before the announcement and only CHIPS showed growth. Cookies persist; their reach keeps shrinking through browser blocking and consent rates.
Is marketing mix modelling only for large advertisers?
It used to be, mostly because it required a consultancy. Open-source frameworks such as Google’s Meridian, released under the Apache licence, lowered the entry cost, and a companion tool, GeoX, runs geo experiments to calibrate the model. The practical threshold is data quality and spend level rather than headcount. Below roughly the cost of a junior analyst in monthly media spend, geo tests will answer your questions more cheaply.
Why does Chinese attribution behave differently from Western attribution?
Because the structure of the market differs. China had 1.125 billion internet users and 602 million generative AI users as of December 2025, per CNNIC, and much commerce happens inside closed super-app loops where payment and purchase sit in the same environment. Cross-site leakage is smaller, platform dependency is larger. The Western problem is fragmented identity across many sites. The Chinese problem is audit rights inside a few platforms.
What is the cheapest way to find out whether a channel actually works?
One geo holdout per quarter. Switch the channel off in matched regions, hold everything else steady, and compare the difference. It costs weeks rather than months, requires no user-level data, and produces a number no platform can dispute because you generated it. Treat every platform-reported figure as a hypothesis until a test has confirmed it.