China vs the World: A Channel-by-Channel Look at Ad Spend
Data vintage: April to October 2026 · Channel: China Data Story, Data Tables · Markets: China, with a global benchmark
Key figures in one block
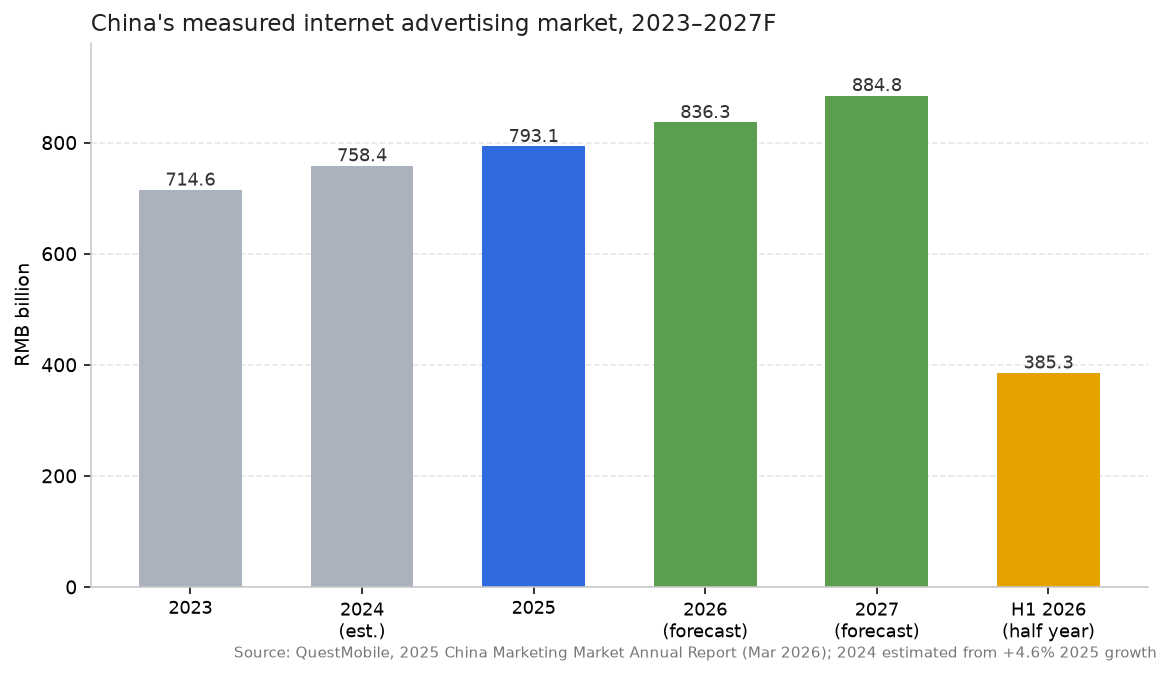
- China measured internet advertising market, 2025: RMB 793.08 billion, up 4.6 per cent year on year.
- Same market, first half of 2026: RMB 385.34 billion, up 7.1 per cent year on year.
- Forecast: RMB 836.26 billion in 2026 and RMB 884.76 billion in 2027.
- Total advertising business revenue, 2025, on the regulator’s wider count: RMB 2.05 trillion, of which internet advertising business revenue was RMB 1.36 trillion. Internet took 89.1 per cent of media advertising publishing revenue.
- Mobile carried 89 per cent of measured ad revenue in the first half of 2025. OTT and smart hardware carried 9 per cent. PCs carried 2.1 per cent.
- Three platforms took 52.4 per cent of hard-ad revenue in the same half: Taobao 22.5 per cent, Douyin 19.1 per cent, WeChat 10.8 per cent.
- Global advertising revenue, 2026: USD 1.3 trillion, up 8.9 per cent, per WPP Media. Traditional plus generative search is 21.8 per cent of it.
- United States digital ad revenue, 2025: USD 294.6 billion, up 13.9 per cent, per IAB and PwC.
The number that opens this section
RMB 793.08 billion. That is what China’s internet advertising market was worth in 2025, measured on the basis media platforms book, according to QuestMobile’s annual marketing market report published on 24 March 2026.
Put it next to 2023, when the same series read RMB 714.61 billion, and you have 11 per cent growth across two years. Put it next to the 2027 forecast of RMB 884.76 billion and you have 11.6 per cent across the next two. Four years of compound growth near 5.5 per cent, and not one year of double digits. Anyone who still describes this market as explosive has stopped reading the series.
The useful question is not how big it is. It is where inside it the money sits, and which part of it is still moving.
Two official totals, one market
China publishes two numbers for advertising, and the gap between them is large enough that people quote whichever one supports the point they were making.
The State Administration for Market Regulation put total advertising business revenue at RMB 2.05 trillion for 2025, with internet advertising business revenue at RMB 1.36 trillion. Xinhua reported in April 2026 that the industry had passed the RMB 2 trillion mark for the first time. The same release put internet at 89.1 per cent of media advertising publishing revenue.
QuestMobile, working from platform books, put the internet figure at RMB 793.08 billion.
Neither is wrong. SAMR counts advertising businesses above a reporting threshold, which means agencies, production houses and service providers sit inside its total alongside media owners. QuestMobile counts what media platforms actually book as ad revenue. Use the regulator’s number to size an industry and count employment. Use the agency number to compare channels, because it is the only series that puts platforms on one consistent basis.
Compare those growth rates and you are comparing definitions rather than disagreements. The measured market grew 4.6 per cent in 2025. The wider count grew 32.6 per cent, a jump steep enough to suggest the reporting base widened at the same time as spend rose.
The measured series, 2023 to 2027
| Period | Measured internet ad market (RMB bn) | Year on year | Note |
|---|---|---|---|
| 2023 | 714.61 | — | Base year |
| 2024 | 758.4 | +6.1% | Estimated from 2025 growth |
| 2025 | 793.08 | +4.6% | Full year |
| First half 2026 | 385.34 | +7.1% | Half year, not annualised |
| 2026 forecast | 836.26 | +5.4% | QuestMobile forecast |
| 2027 forecast | 884.76 | +5.8% | QuestMobile forecast |
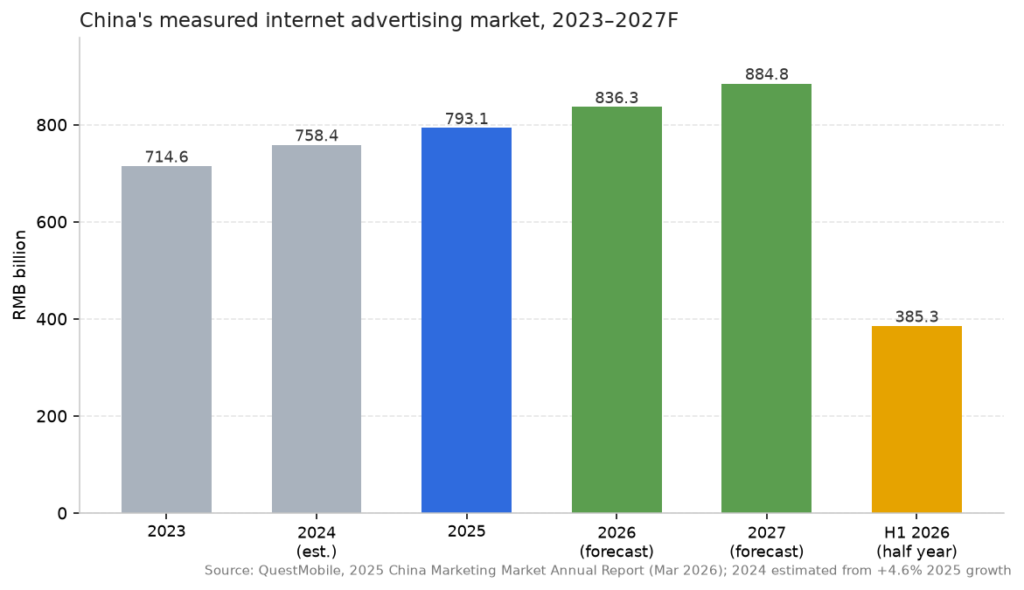
Two things to hold onto in that table. First, 2025 was the slowest year of the four, and 2026 opened faster than the year it followed. Second, the growth rates here are nominal, in a category where ad load and price both move. A 4.6 per cent year is a real increase in spend and a modest increase in inventory value.
China by surface: phone, big screen, desktop
This is the cleanest channel split China publishes, because it is measured by device rather than by platform type.
| Surface | Share of ad revenue, H1 2025 | 2025 equivalent (RMB bn) | Direction |
|---|---|---|---|
| Mobile | 89% | about 705.8 | Core, still dominant |
| OTT and smart hardware | 9% | about 71.4 | Gaining, taking share from PC |
| PC | 2.1% | about 16.7 | Shrinking |
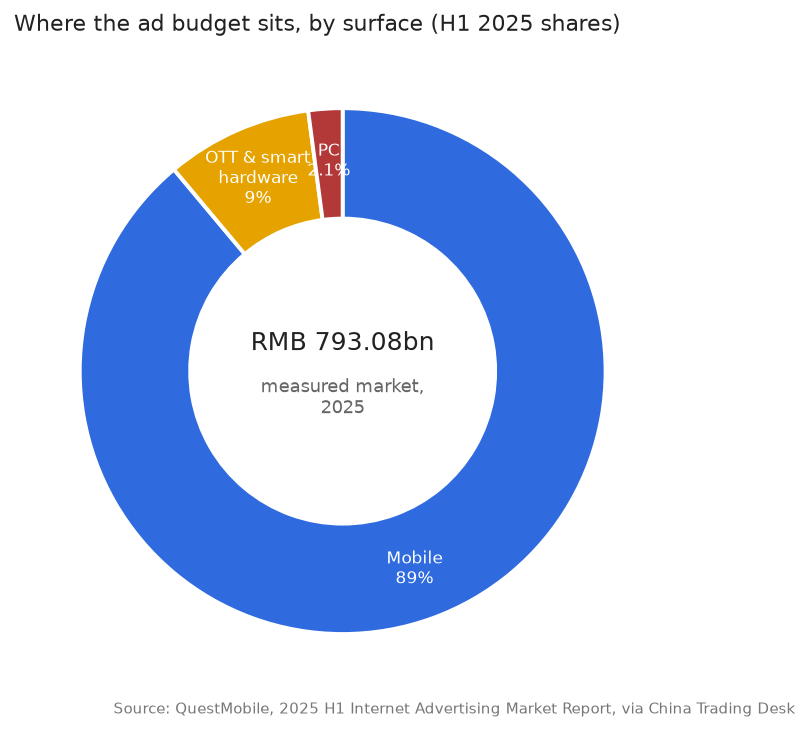
The shares are QuestMobile’s, measured in the first half of 2025 and published by China Trading Desk. The RMB figures are this section’s arithmetic: those shares applied to the 2025 measured market of RMB 793.08 billion. They sum to 100.1 per cent before rounding, which is a detail in the source rather than a mistake here.
The interesting row is the middle one. Nine per cent sounds small until you convert it: roughly RMB 71 billion a year spent on television screens that are connected to the internet, in a market where household viewing has not collapsed the way it did in the West. QuestMobile’s 2025 annual report describes big screens as a core household entry point and reports them steadily absorbing budget that used to go to desktop.
Half the hard-ad money sits in three apps
| Seller | Category | Share of hard-ad revenue, H1 2025 | Implied H1 2025 revenue (RMB bn) |
|---|---|---|---|
| Taobao (Alibaba) | E-commerce, in-platform | 22.5% | about 81.0 |
| Douyin (ByteDance) | Short video | 19.1% | about 68.7 |
| WeChat (Tencent) | Social | 10.8% | about 38.9 |
| Top three combined | — | 52.4% | about 188.6 |
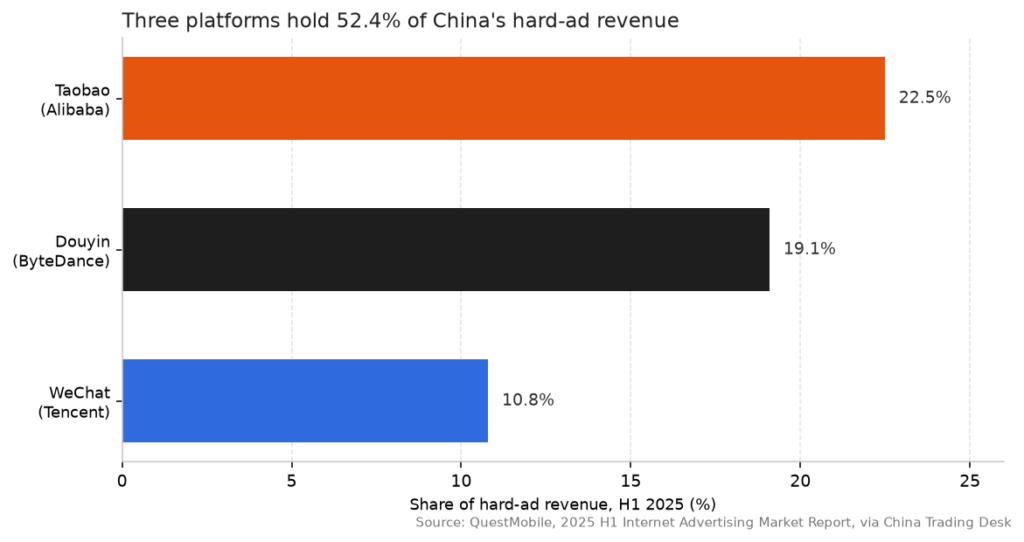
These are hard-advertising shares, the paid inventory that sits in a feed, a search result or a splash screen. They leave out soft advertising, the creator content and seeding work that Chinese brands buy through agencies and key opinion leaders, which is a large and separately measured pool. Read the table as the paid-media layer, not the whole marketing economy.
Concentration at 52.4 per cent is high for any market. It also explains the thing overseas buyers find strangest about China: there is no long tail of meaningful inventory. Below the top three, the sellers that matter number fewer than a dozen.
What moved in 2026: short video took the increment
QuestMobile’s first-half 2026 report reads like a budget memo. Its summary of the shift is direct: budgets tilted further toward short video, in-platform e-commerce advertising held its position, and news, long-form video and search lost share.
The same report records a change in how hard-ad money is spent. Performance advertising made up about 90 per cent of hard-ad budgets and fell to about 80 per cent, with brand advertising taking the difference. That is a reversal of a decade-long trend, and it arrives in the same half year that advertisers were told every yuan had to be accountable.
Two forces are stacked here. Short video is where attention still grows, and its auction rewards creative volume. Brand budgets returned because the supply of cheap performance inventory thinned out as e-commerce platforms pulled back from public-domain buying.
E-commerce holds the share. The budget behind it moved.
The obvious reading of the outline this section replaces was that short video and e-commerce were both absorbing incremental budget. Half of that is now wrong, and the correction matters for anyone building a plan from it.
In-platform e-commerce advertising, the inventory sold inside Taobao, Pinduoduo and JD, has held its share of the measured market. What changed is where the brands went. QuestMobile reports that the online shopping sector cut public-domain ad budgets and moved money into user subsidies and live rooms. In plain terms: the platforms still sell the same share of ads, but the merchants behind them are buying fewer impressions and more discount.
Read this as a squeeze on the advertiser side rather than the seller side. A plan that assumes rising e-commerce ad prices in 2027 is building on a trend that has already turned.
Search lost share. That is not the same as losing money.
Search is the channel everyone has written off twice, once when super apps arrived and again when chatbots did. The measured data says its share is being squeezed, not that its revenue has collapsed.
QuestMobile’s first-half 2026 work names search among the channels losing share, alongside news and long-form video. The mechanism is visible in behaviour. AI assistants now answer the generic question before a search results page can, and the clicks that used to fund generic queries are thinning. What survives is the query with commercial intent attached: a price, a warranty, a dealer in a named city, a part number.
Globally the same shift is being priced rather than mourned. WPP Media’s midyear 2026 forecast has traditional search and generative search together at 21.8 per cent of total ad revenue, and treats generative search as the fastest-expanding channel in advertising history, growing from USD 5.1 billion in 2026 toward more than USD 100 billion by 2030.
The AI buyer arrived and changed the demand mix
The newest demand pool in China is the AI companies themselves, and they buy the way venture-funded companies buy: fast, concentrated, and in public.
QuestMobile’s 2025 annual work found that 70 per cent of the hard-ad budget placed by AI application companies went to three products, split 38.5, 21.2 and 12.6 per cent. That is a category spending at scale before it has a revenue model of its own.
The audience underneath it is now mainstream. China counted more than 700 million generative AI users by mid-2026, per CNNIC as reported by Xinhua in September 2026, and AI-native apps alone reached 546 million monthly users by September 2026. Enterprise money is arriving on a different track: China’s model-as-a-service market took RMB 10.63 billion in the first half of 2026, up 889.4 per cent and a near ninefold rise, according to IDC.
For a media plan this cuts two ways. AI applications are the reason some feed inventory got more expensive. They are also the first large advertiser category in years that behaves like a launch market rather than a maintenance market.
The global yardstick: USD 1.3 trillion
WPP Media’s This Year Next Year midyear forecast, published on 30 June 2026, put global advertising revenue at USD 1.3 trillion for 2026, up 8.9 per cent and revised from the 7.1 per cent it forecast in December. Advertising’s share of global GDP is the highest since 1999, above the dot-com peak, and it got there on performance spending rather than speculative branding. The forecast’s web summary still shows an earlier 5.1 per cent growth figure; the 8.9 per cent from the 30 June press release is the operative number.
Three structural facts sit inside that total:
- Social remains the largest single channel, and its growth decelerates to single digits from 2027, with time spent flattening and age restrictions spreading.
- Commerce, led by retail media, is described as the foundation the industry is being built on, and it faces a new problem as purchase decisions move toward generative search and AI agents.
- Content-driven advertising is projected at USD 720.2 billion in 2026, up 8.2 per cent, with its share of the total set to fall by 2031.
Apply the search share to the total and traditional plus generative search is about USD 283 billion this year. That is the number to carry into any argument about where AI answers are taking money from.
The channel table that does add up, on one market
China does not publish a clean five-way revenue split by channel type, and this section will not invent one. The United States does, and the shape is instructive.
| Category | 2025 revenue (USD bn) | Year on year | Share of US digital ad revenue |
|---|---|---|---|
| Search | 114.2 | +11% | 38.8% |
| Social | 117.7 | +32.6% | 40.0% |
| Display | 81.6 | +9.8% | 27.7% |
| Digital video | 78.0 | +25.4% | 26.5% |
| Commerce media | 63.4 | +18% | 21.5% |
| Podcast | 2.9 | +17.6% | 1% |
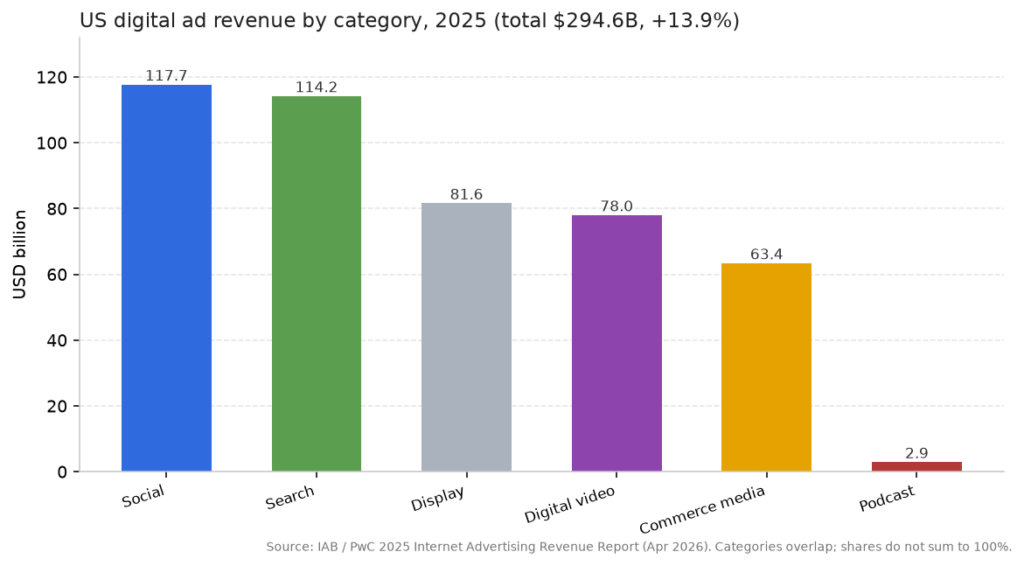
Source: IAB and PwC, 2025 internet advertising revenue report, published 16 April 2026. Total market USD 294.6 billion, up 13.9 per cent.
The shares overlap. Video and commerce media are counted inside display and social in places, so the column does not sum to 100. Read each row against the total, never against the other rows.
Even with that caveat, two rows do the work. Social at 40 per cent and 32.6 per cent growth is the same pattern WPP describes globally, and commerce media at 21.5 per cent is the retail-media story in one line. Search at 38.8 per cent of a market that grew 11 per cent looks healthier than the Chinese share-loss narrative suggests, which is exactly the point: search is losing share while still adding revenue.
What this means for a budget plan
Put the increment in short video, but buy it as reach with a frequency cap. It is the one channel taking share in China, and the platform concentration means incremental reach is easy to buy and easy to over-buy.
Hold in-platform e-commerce for conversion, not for growth. The share is stable and the merchant behaviour behind it is not. Price the channel on cost per sale, not on last year’s CPM curve.
Treat search as a defensive line. Generic queries are migrating to AI answers. Branded terms, product numbers and local intent still convert, and they are worth defending at a lower budget than a 2024 plan would have allocated.
Buy the surface, not the app name. Nine per cent of measured revenue sits on connected television and smart hardware, and it is growing. Most overseas plans for China still name apps only.
Separate the two totals before you compare with anything. RMB 793 billion and RMB 1.36 trillion describe the same market at two scopes. Quoting one against a global figure and the other against a platform figure produces a comparison that cannot be defended.
Frequently asked questions
Is China’s internet ad market RMB 793 billion or RMB 1.36 trillion?
Both, at different scopes. RMB 793.08 billion is what media platforms booked in 2025. RMB 1.36 trillion is the regulator’s count of advertising business revenue earned by internet-related businesses, which includes agencies and service providers. Use the first for channel comparison, the second to size the industry.
Why did measured growth slow to 4.6 per cent in 2025 and then speed up to 7.1 per cent?
Because 2025 was a year of budget caution, with platforms reporting slower price growth and advertisers holding spend, and the first half of 2026 carried a heavier campaign calendar plus a surge of AI-application advertising. Half-year rates are noisy; the four-year trend sits near 5 to 6 per cent.
Which channel actually gets the incremental budget?
Short video, and mostly through feed and creator-adjacent inventory. In-platform e-commerce advertising has held its share rather than gained it, and search, news and long-form video have lost share.
Are e-commerce ads still the biggest single pool in China?
In-platform e-commerce advertising is the largest single category of hard-ad inventory, and Taobao alone took 22.5 per cent of hard-ad revenue in the first half of 2025. But the merchants funding it are shifting budget from impressions to subsidies and live rooms, so share stability is not the same as demand growth.
What single number should a foreign marketer watch for the AI shift?
Search, traditional plus generative, at 21.8 per cent of global ad revenue in 2026. In China, watch whether short video’s share gain continues once AI-application advertising stops growing at launch-market speed.