Every KPI Is an Instruction. Read Yours Before Your Team Does.
Here is a sentence that should make every marketing leader slightly uncomfortable: your dashboard is not describing your team. It is instructing them.
We tend to talk about KPIs as though they were thermometers — passive instruments that report a temperature that exists independently of them. They are not. They are thermostats. The moment you name a number and attach a consequence to it, people reorganise their effort around producing that number. Sometimes producing the number and producing the business are the same act. Often they are not, and the gap between them is where careers, budgets and occasionally entire institutions quietly go wrong.
This is the whole craft of KPI design: deciding which behaviour you want to install, then engineering the metric so that the cheapest way to improve it is to actually do the work.
Goodhart’s Law Is Not a Warning. It Is the Job Description.
In 1975, the British economist Charles Goodhart — then advising the Bank of England — noticed something irritating. Whenever a government picked a previously reliable statistical relationship and leaned on it for control purposes, that relationship collapsed. Money supply aggregates that had tracked inflation beautifully stopped tracking it the moment policy targeted them.
The line everybody actually quotes came later, and not from Goodhart. In 1997 the anthropologist Marilyn Strathern, writing about audit in British universities and crediting the accounting scholar Keith Hoskin, compressed the idea into eleven words: when a measure becomes a target, it ceases to be a good measure.
Notice what this does not say. It does not say measurement is bad. It says measurement changes the thing measured, and that this is predictable rather than accidental. Which means it is a design constraint you can plan around — not a curse you can only complain about afterwards.
The Sentence Everyone Quotes Was Written About Universities, Not Sales Targets
That origin matters more than it sounds. Strathern was describing academics, not account managers. Donald Campbell had reached a parallel conclusion in a 1976 working paper published in journal form in 1979: the more any quantitative social indicator is used for social decision-making, the more subject it will be to corruption pressures, and the more apt to distort the very process it was meant to monitor.
Three different disciplines — monetary economics, anthropology, program evaluation — arrived independently at the same finding within about four years. When that happens, you are not looking at a quirk of one industry. You are looking at something structural about humans and incentives.
Two Kinds of KPI: The Distinction That Runs the Whole Playbook
Sort every metric you own into one of two buckets.
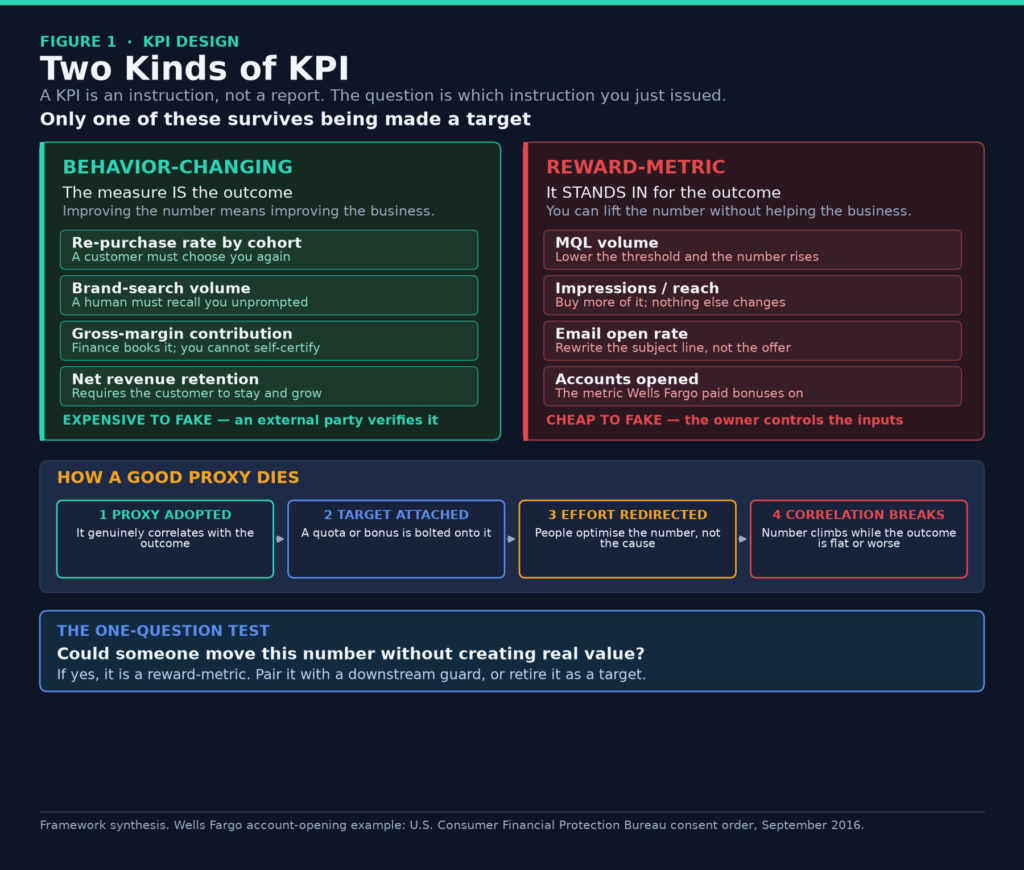
A behavior-changing metric points at the outcome itself. Improving the number is improving the business. Re-purchase rate by cohort. Brand-search volume. Gross-margin contribution. Net revenue retention. For any of these to move, something real has to happen in the world — usually involving another person choosing you.
A reward-metric points at a proxy. You can lift it without helping anything. MQL volume. Impressions. Email open rate. The number of accounts opened.
Here is the test, and it takes about four seconds: could someone move this number without creating real value? If the answer is yes, you have a reward-metric on your hands. That is not automatically disqualifying — proxies are useful — but it is disqualifying for using it as a target on its own.
Why Proxies Decay on a Predictable Schedule
Nobody adopts a bad metric on purpose. MQLs were a reasonable invention: give sales and marketing one shared definition of a lead worth working. The decay follows a reliable four-step pattern.
The proxy is adopted because it genuinely correlates with the outcome. A target gets attached — a quota, a bonus, a board slide. Effort redirects toward the number rather than the cause, because the number is what is watched. And then the correlation breaks. The number climbs while the outcome sits flat or deteriorates.
The design move most teams miss is step two. The proxy was fine as a diagnostic. It became dangerous the instant it became a destination. Knowing when to retire a proxy as a target — while keeping it on the dashboard as a signal — is a genuine skill, and almost nobody has a process for it.
Three Institutions That Learned This the Expensive Way
Steven Kerr put the mechanism plainly in the Academy of Management Journal in 1975, in a paper whose title has aged into a proverb: on the folly of rewarding A while hoping for B. His observation was blunt — whether dealing with monkeys, rats or human beings, most organisms seek information about what activities are rewarded, then seek to do, or at least pretend to do, those things, often to the virtual exclusion of activities not rewarded.
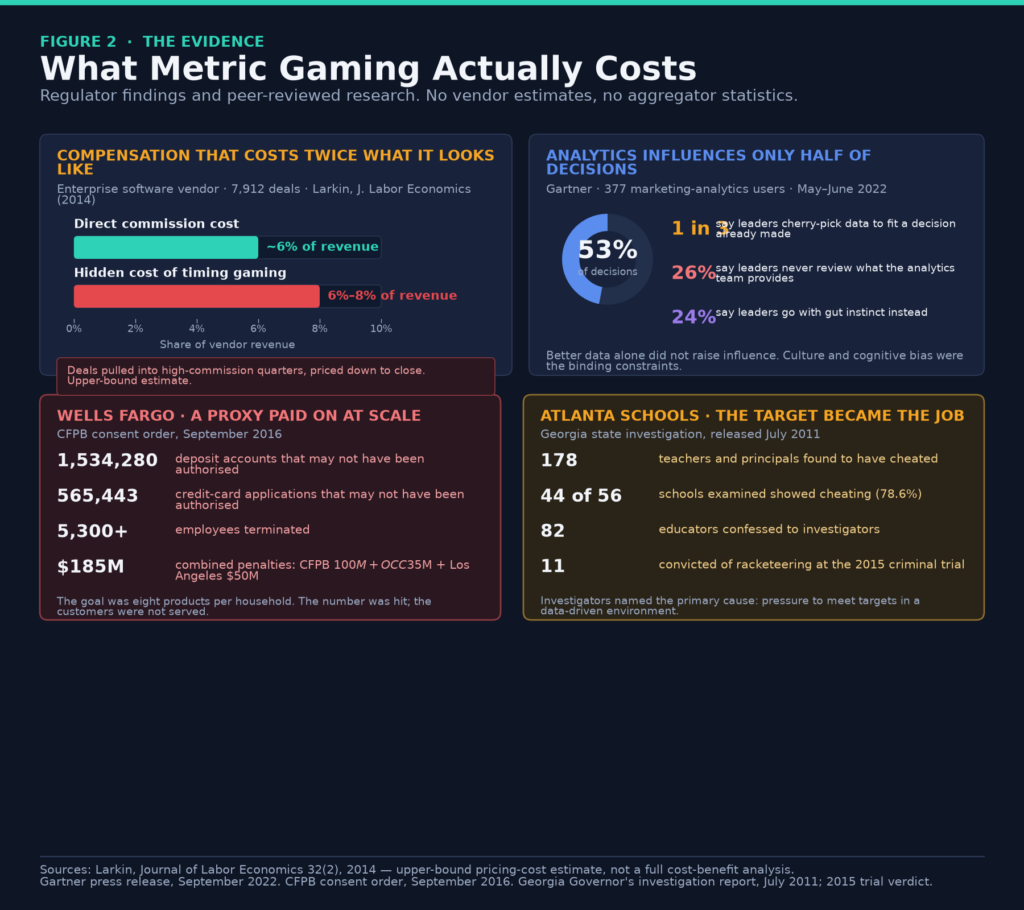
Wells Fargo is the case study that should be laminated and pinned above every demand-gen desk. The bank chased a cross-sell ambition of eight products per household and paid bonuses against it. The Consumer Financial Protection Bureau’s September 2016 consent order documented 1,534,280 deposit accounts that may not have been authorised, and 565,443 credit-card applications that may not have been authorised. At least 5,300 employees were terminated. Combined penalties reached $185 million — $100 million from the CFPB, $35 million from the OCC, $50 million from the City and County of Los Angeles.
Read that again with the framework in mind. The metric was hit. Spectacularly. The outcome the metric was supposed to represent — customers who genuinely wanted more of the bank’s products — was not merely missed but actively damaged. This was not a measurement failure. It was a measurement success, aimed at the wrong thing.
The Atlanta Public Schools investigation, released by Georgia’s governor in July 2011, found the same architecture in education. Investigators identified 178 teachers and principals who had cheated, across 44 of the 56 schools examined — 78.6%. Eighty-two confessed. Eleven were convicted of racketeering at the 2015 criminal trial. The report named the primary cause directly: pressure to meet targets in a data-driven environment, inside a culture of fear, intimidation and retaliation.
And in Britain, the Francis Inquiry into Mid Staffordshire NHS Foundation Trust concluded in 2013 that managers had prioritised hitting targets and achieving foundation-trust status over the safety of patients.
One correction worth making, because it is repeated constantly: the widely circulated figure of 400 to 1,200 excess deaths at Mid Staffs is a contested statistical estimate, not a body count. It was removed from the Healthcare Commission’s published report over concerns it would be misunderstood. Robert Francis himself wrote that it would be misleading and a potential misuse of the figures to extrapolate any particular number of deaths caused by inadequate care. If you cite that range as settled fact, you are committing exactly the error this article is about — treating a proxy as the thing itself.
The 6% Nobody Puts in the Business Case
Most arguments about metric gaming stay qualitative. One remarkable study does not.
Ian Larkin, publishing in the Journal of Labor Economics in 2014, examined 7,912 deals at a leading enterprise software vendor with an accelerating commission scheme. Salespeople, unsurprisingly, learned to game the timing of deal closure — pulling deals into quarters where their marginal commission was higher, and cutting price to make sure those deals closed on schedule.
The cost of that mispricing came to 6% to 8% of vendor revenue. Direct commissions averaged about 6%. Which means compensating the sales force was roughly twice as expensive as it appeared on any spreadsheet that counted only the commissions paid.
Two honest caveats. Larkin describes this as an upper bound, and it is not a full cost-benefit analysis — incentive schemes also buy effort and better hiring. But the direction is unambiguous, and the mechanism is exactly the one your MQL target runs on. The visible cost of an incentive is never the whole cost.
Five Design Rules That Make a Metric Expensive to Fake
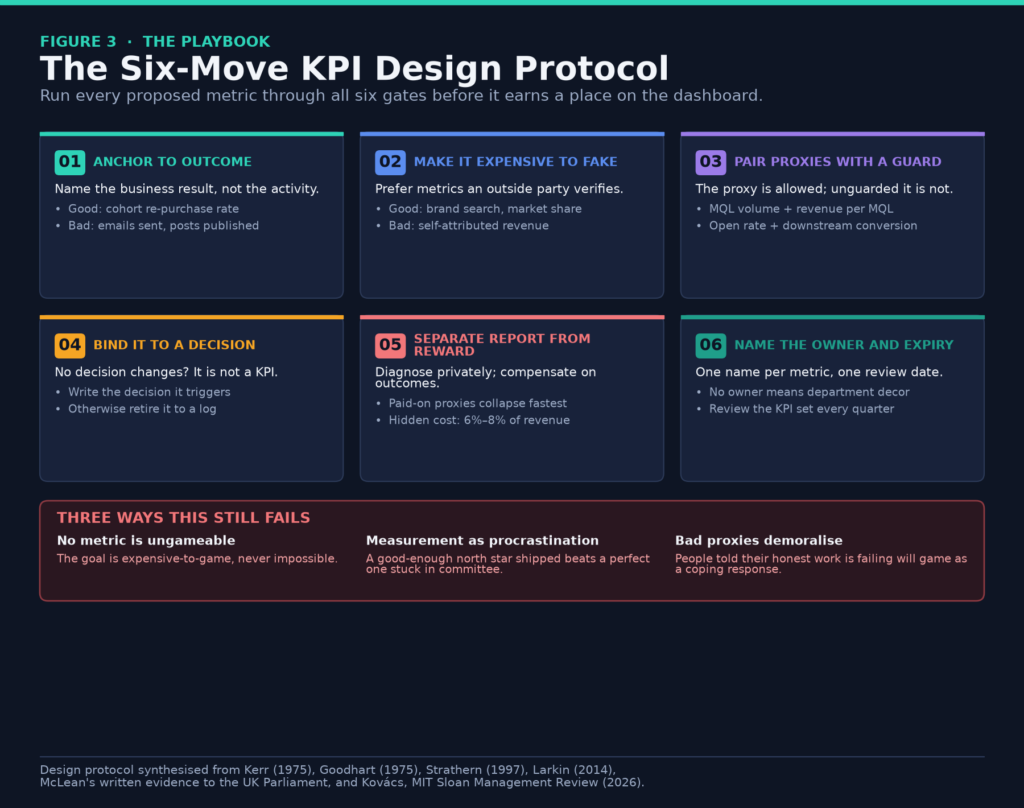
Anchor to the outcome, not the activity. Cohort re-purchase rate, not emails sent. Gross-margin contribution, not posts published. Activity metrics measure whether you were busy. Nobody was ever promoted for being busy.
Prefer metrics with an external verifier. This is the sharpest tool available. Professor Iain McLean of Nuffield College, Oxford, made the argument in written evidence to the UK Parliament: to minimise the impact of Goodhart’s law, a measure must be insulated as far as possible from its beneficiaries. Brand search is verified by a human who had to remember you. Market share is verified by a competitor’s loss. Re-purchase is verified by a customer’s wallet. Self-attributed revenue is verified by you, which is to say not verified.
Pair every proxy with a downstream guard. Keep MQLs if you like — but bolt revenue per MQL and MQL-to-closed conversion alongside them. The proxy can still be gamed, but the gaming now surfaces one row down instead of never.
Bind each metric to a decision. If no decision changes when the number moves, it is not a KPI. It is decoration with a chart attached. Demote it to a log.
Write the failure mode next to the metric. Literally: a column titled how someone could game this. If filling it in takes you three seconds, redesign the metric before you ship it. This single habit catches more bad KPIs than any framework.
How Much Should a KPI Actually Influence? Less Than You Think
Gartner surveyed 377 users of marketing analytics in May and June 2022 and found analytics influencing just 53% of marketing decisions. One third of respondents said decision-makers cherry-pick data to fit a conclusion already reached. Twenty-six percent said leaders never review what the analytics team provides; 24% said they go with gut instinct instead.
Gartner’s own reading of this is the useful part: better data alone did not increase influence. The binding constraints were cognitive bias and culture. Their recommendation to combat cherry-picking is precisely a KPI-design recommendation — set your KPIs and metrics before launching the campaign, not after the data starts arriving.
Choose your metrics before you know which ones will flatter you. Everything else is motivated reasoning with a dashboard.
The Measurement Asymmetry That Quietly Kills Brand Budgets
There is a structural reason marketing teams drift toward proxies, and it is not stupidity. It is that proxies are easier to see.
Les Binet and Peter Field’s analysis for the IPA, drawing on the IPA Effectiveness Databank of 996 campaigns, found the well-known benchmark of roughly 60% brand building to 40% sales activation. The part that matters here is the asymmetry underneath it. Activation effects are immediate, large and easy to measure. Brand effects accrue over six months or more and are systematically undercounted by short measurement windows.
So the metrics that are easiest to defend in a quarterly review are the ones capturing the smaller share of long-run payback. The dashboard is not lying. It is just looking through a window too short to see the rest.
Binet and Field are explicit that 60:40 is a benchmark rather than a constant, and it shifts by category — B2B skews lower on brand. Treat it as a calibration prompt, not a law.
Separate the Report From the Reward
This is the governance layer, and it is where most KPI advice stops too early.
A metric you track privately for diagnosis should not automatically be the metric you compensate publicly. The moment a proxy is paid on, it is played — that is the entire Goodhart mechanism compressed into one sentence, and Larkin’s 6–8% is what it costs in practice.
Give every metric one named owner. Not a department — a person. A KPI owned by everyone is owned by nobody, and it becomes wall art within a quarter.
Then review the KPI set itself, quarterly, as a separate exercise from reviewing performance. Metrics decay as the business changes. A proxy that was honest two years ago may be trivially gameable now. Most organisations review the numbers religiously and never review the choice of numbers at all.
The Half of the Buying Committee Your Metrics Cannot See
There is a specific B2B version of this blind spot worth naming.
Research by LinkedIn’s B2B Institute with Bain & Company, fielded through NewtonX, examined how buying groups rather than individuals make decisions. Their finding: roughly half the decision influence sits with what they call hidden buyers — procurement, finance, legal, IT — people whose job is to assess the risk of buying rather than the merit of the product. These people leave almost no digital trail. They do not download whitepapers. They are structurally invisible to an MQL-based system, and they hold a veto.
Two disclosures, because they matter. LinkedIn sells B2B advertising and Bain sells consulting, so this is vendor-commissioned research with a commercial interest in its conclusions. And the survey work concentrated on two enterprise software categories, which limits how far you should generalise it. Treat it as a strong signal about a real blind spot, not a universal constant.
The design lesson stands regardless of the exact percentage: if your metric system can only see people who behave like product evaluators, it will systematically undercount the people who decide.
What Machine Learning Figured Out Before We Did
Writing in MIT Sloan Management Review in January 2026, Balázs Kovács of the Yale School of Management made an argument that reframes this whole problem. Organisations optimising proxy measures face the same failure mode machine-learning researchers call overfitting: optimise hard enough against a proxy and you fit its noise rather than the signal it was standing in for.
The borrowing is useful because machine learning has developed actual countermeasures — simpler models when oversight is limited, more realistic evaluation environments, better sampling, and regularisation: deliberate constraints that make gaming more expensive than genuine performance.
That last one is the transferable idea. You are not trying to build an ungameable metric. You are trying to raise the price of gaming above the price of doing the work.
Kovács is careful about the limit, and so should we be: organisations contain people with agency and complex motives that algorithms lack. These are frameworks requiring human adaptation, not mechanisms you can install.
Four Honest Caveats
No metric is ungameable. Re-purchase can be nudged with discounts. Brand search can be inflated with a campaign that says your name loudly. The goal is expensive-to-game, never impossible.
Design can become procrastination. A good-enough north star shipped this week beats a perfect KPI framework stuck in committee until Q3.
Paid-on proxies collapse fastest. If you take one operational rule from this piece, take that one.
Bad proxies demoralise people. A metric that tells someone their honest work is failing does not produce better work. It produces gaming as a coping mechanism, and then it produces attrition. Design should respect the humans on the receiving end of the number.
The Takeaway
You cannot opt out of having KPIs. You can only choose which behaviour they install.
A KPI either changes behaviour — pointing at the outcome, so improving it improves the business — or rewards the appearance of it, pointing at a proxy you can inflate without creating anything. Goodhart’s law is not an argument against measurement. It is the operating manual for it.
Name the number you want your team to genuinely become good at. Make it expensive to fake. Guard every proxy with a downstream outcome. Give it an owner, an incentive aligned to the real result, and an expiry date.
Measure what you want to become. Not what looks good on the dashboard.