You Can’t Average Three Currencies: Why Your Brand Score Hides the Real Problem
Ask ten marketers how their brand is doing and you’ll get ten versions of the same non-answer: “Pretty strong. Awareness is up.” Up compared to what? Among whom? And does anyone who knows the brand actually intend to buy it? Silence, usually. We’ve built an industry that can track a click through six devices and four platforms, yet most brand dashboards still boil everything down to one blurry number — a “brand score” that moves a point or two each quarter and tells you absolutely nothing about what to fix.
Here’s the uncomfortable truth: awareness, consideration and purchase intent aren’t three stops on one line. They’re three different currencies. And the most valuable information in your entire brand tracker isn’t in any of the totals — it’s in the gaps between them.
The Number That Never Moves (and Why)
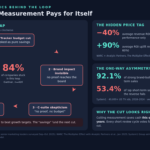
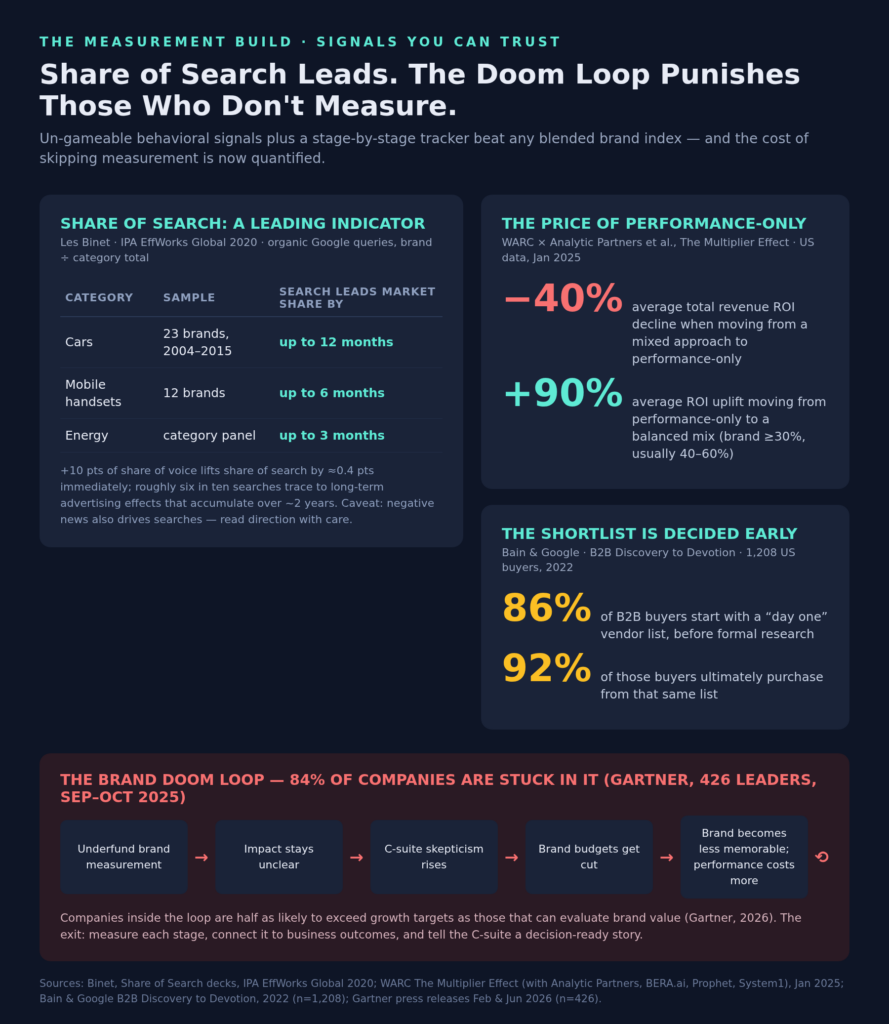
Gartner’s 2026 research put a figure on how widespread this dysfunction is: 84% of companies are stuck in what it calls a brand “doom loop” — underfunded measurement produces unclear impact, unclear impact breeds C-suite skepticism, skepticism shrinks budgets, and smaller budgets fund even weaker measurement. That finding comes from a survey of 426 senior marketing leaders conducted in September and October 2025. Companies trapped in the loop were half as likely to exceed their growth targets as those that could actually evaluate brand value.
Read that again. The measurement problem isn’t a reporting inconvenience. It’s a growth penalty.
And the loop starts with a design flaw: we measure three different things as if they were one thing.
Three Currencies, Not One Line
Think of your brand health as an economy with three currencies, each with its own exchange rate.
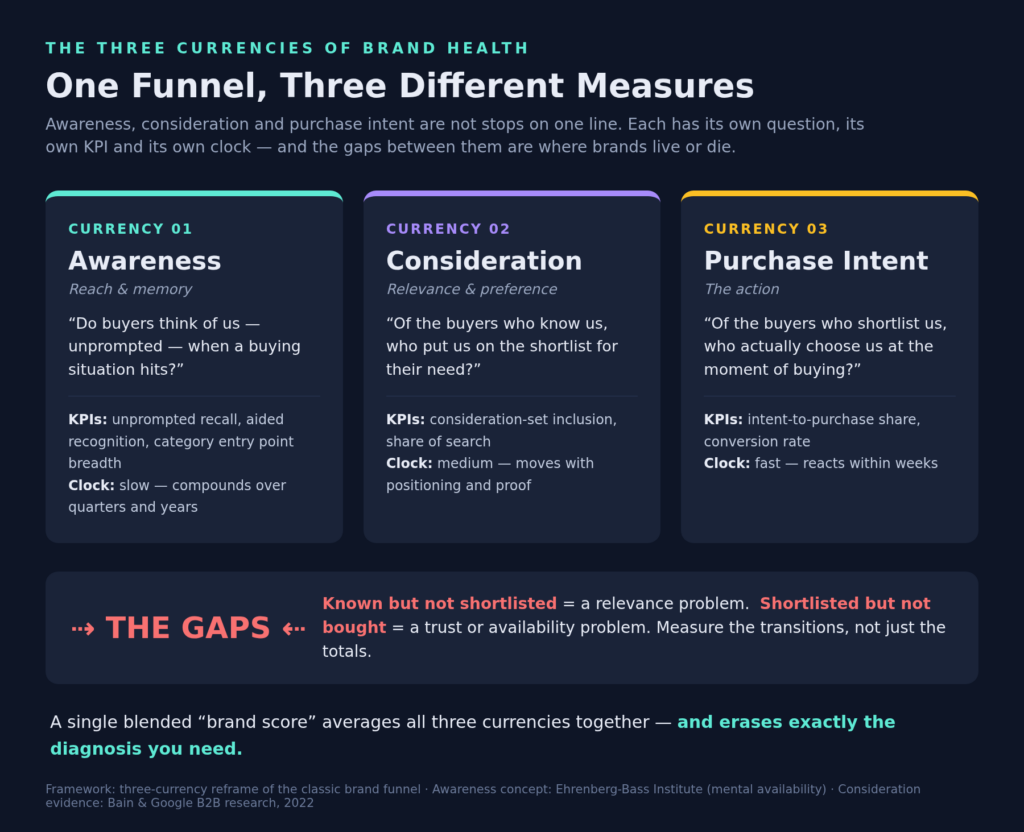
Awareness is memory. Do buyers know you exist — and more importantly, do they think of you when a buying situation actually hits?
Consideration is preference. Of the people who know you, who puts you on the shortlist for their specific need?
Purchase intent is action. Of the people who shortlist you, who follows through at the moment of choice?
Each currency has different levers, different audiences and different clocks. Averaging them into one “brand health index” is like averaging your salary, your savings and your credit score because they’re all money-ish. The composite feels tidy. It destroys the diagnosis.
Awareness: The Currency of Memory
The Ehrenberg-Bass Institute, the research body behind Byron Sharp’s How Brands Grow, makes a distinction most trackers ignore: mental availability is not the same as awareness. Their definition is precise — the propensity of a brand to be noticed, recognized or thought of in buying situations. Not in a survey. In a buying situation.
Why does that matter? Because classic awareness questions cue people with a single prompt — usually the category name. “Which car brands come to mind?” That measures whether you’ve memorized a list, not whether you surface when someone’s lease expires, their family grows, or their commute changes. Ehrenberg-Bass researchers have argued for years that these single-cue measures are structurally flawed, and that salience should be measured across the many situations — category entry points — that actually trigger purchases.
So when your tracker says awareness is 82%, ask: 82% of what, cued by what, in which situations? A brand can be universally recognized and practically invisible at the moment that matters.
Consideration: The Currency of Preference
Consideration is where famous brands go to die quietly. Everyone knows you. Nobody shortlists you.
If you want evidence of how brutally early this stage is decided, look at B2B. Bain and Google surveyed 1,208 US buyers in their 2022 Discovery to Devotion study and found that 86% began their buying process with a “day one” list of vendors already in mind — before any formal research. And 92% of those buyers ultimately purchased from that same list.
The shortlist forms before the search begins. Which means consideration isn’t won at the comparison-table stage; it’s won months or years earlier, in memory. If you’re not on the day-one list, your beautifully optimized demo request page is mostly theater.
This is the most common and least diagnosed brand failure: a relevance problem masquerading as an awareness success. People know you — they just don’t see you as being for their need.
Purchase Intent: The Currency of Action
Intent is the currency performance marketers know best, because it’s the one their dashboards already count. But intent has its own failure mode: a brand can be shortlisted and still lose at the shelf, the checkout or the procurement review. Price, proof, availability, friction — the last three feet of the journey have killed more shortlists than any competitor’s ad campaign.
The point isn’t that intent matters less. It’s that intent is downstream of two other currencies, and it moves on a completely different clock. Which brings us to the gaps.
The Three Gaps Where Brands Actually Live or Die
Here’s the framework I’d tape to every brand team’s wall:
Gap one: awareness → consideration. Known but not shortlisted? That’s a relevance problem. Your memory structures exist but they’re not connected to buying situations. The fix is positioning and category entry points, not more reach.
Gap two: consideration → purchase. Shortlisted but not chosen? That’s a trust or availability problem. The fix is proof, pricing, distribution or friction removal — not another brand campaign.
Gap three: unaided → aided. Big drop between spontaneous recall and prompted recognition? Your awareness is borrowed, not owned. People recognize you when shown your logo, but you don’t come to mind on your own. That’s a shallow memory trace, and it’s fragile.
Notice what happens when you blend everything into one score: all three gaps vanish. The number can hold steady while a relevance crisis quietly hollows out your pipeline. Measure the transitions, not just the totals. That’s where the diagnosis lives.
What Actually Moves These Numbers: The Binet & Field Evidence
If the gaps tell you where the problems are, Les Binet and Peter Field’s research tells you which spending fixes which stage. Their 2013 report for the IPA, The Long and the Short of It, analyzed 996 campaigns entered into the IPA Effectiveness Awards between 1980 and 2010 — a databank covering roughly 700 brands across more than 80 categories.
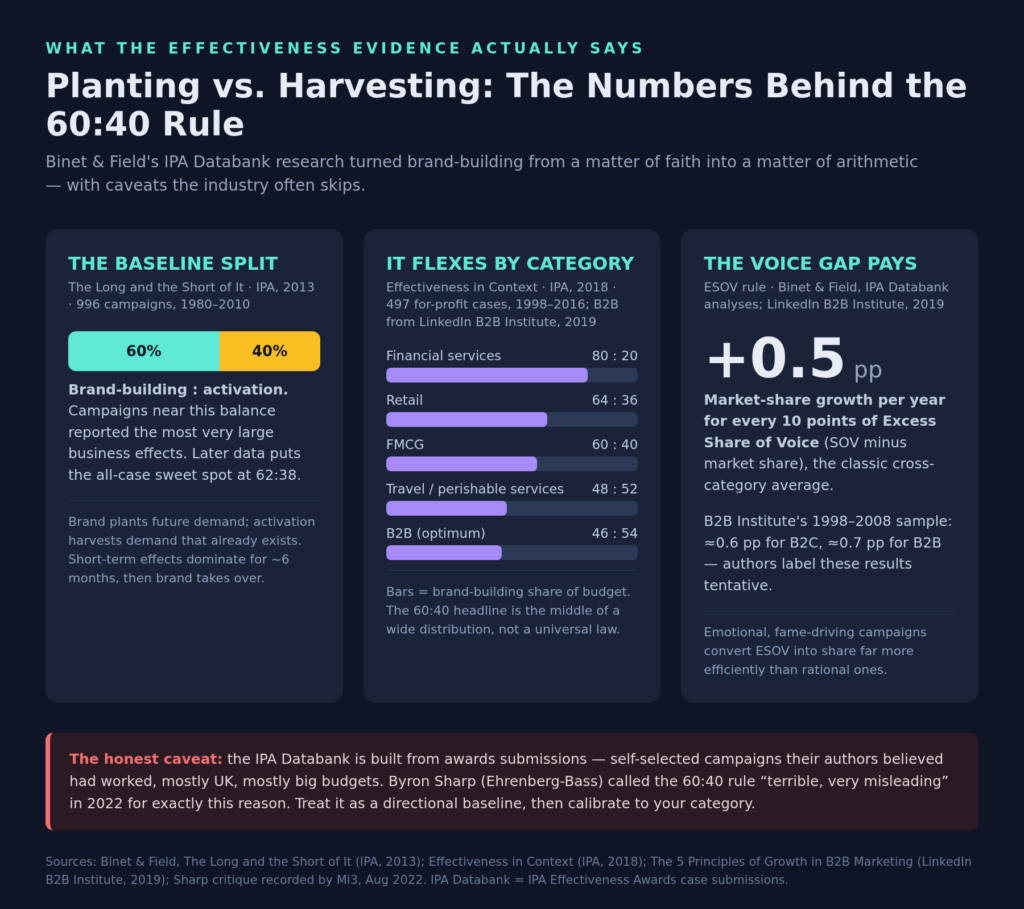
The famous output is the 60:40 rule: campaigns that put roughly 60% of budget into long-term brand-building and 40% into short-term sales activation reported the most very large business effects. Their later analysis refined the all-case sweet spot to 62:38.
The mechanism is the part worth internalizing. Activation harvests demand that already exists — it’s efficient, measurable, and it fades within about six months. Brand-building plants demand that doesn’t exist yet: it builds the memory structures that make future buyers think of you, and its effects compound for years. A measurement system that only watches conversion is reading the harvest while ignoring the planting. Eventually the field goes barren — and performance costs climb, because you’re now paying to convert people who’ve never heard of you.
The Asymmetry Nobody Priced In
Here’s the finding that should reshape how you judge creative: the relationship between brand and sales effects runs one way.
System1, the ad-testing company, analyzed more than 40,000 US TV ads aired between mid-2018 and mid-2024. Of the ads scoring 4–5 stars on its long-term brand-building measure, 92.1% also delivered above-average short-term sales potential. Flip it around: among the top quartile of ads for short-term sales potential, 53.4% had only weak long-term brand scores. A separate System1 analysis of 27,000 UK ads, cited by Mark Ritson in WARC in 2026, points the same direction — five-star brand ads also drive stronger short-term sales.
Brand-building does double duty. Activation-only mostly doesn’t.
One honest flag: System1 is a commercial testing vendor, and the Star and Spike ratings are its own proprietary, sold products — this is vendor-generated evidence that conveniently supports what System1 sells, and Ritson has a paid relationship with the firm. Take the direction seriously; treat the exact percentages as interested testimony, not independent audit.
The 60:40 Rule Is a Baseline, Not a Law
Before you tattoo 60:40 on the media plan, two corrections.
First, it flexes — a lot. Binet and Field’s 2018 follow-up, Effectiveness in Context, drew on 497 for-profit cases from 1998–2016 and found optimal brand shares running from around 80:20 in financial services to 48:52 in travel and perishable services. The B2B-specific analysis they wrote for LinkedIn’s B2B Institute in 2019 landed near 46:54 — and the authors themselves labeled those results tentative. The headline number is the middle of a wide distribution, not a commandment.
Second, the dataset has a real weakness, and it deserves airtime. The IPA Databank is built from awards submissions: campaigns their authors believed had worked, self-reported, skewed toward UK brands with big budgets. Byron Sharp said exactly this at the Mi3-LinkedIn B2B Next summit in August 2022, calling the 60:40 rule “terrible, very misleading” — the industry wanted a number, he argued, and this was the only data available to produce one. Binet and Field acknowledge the bias themselves. The fair reading: the direction (most brands underinvest in brand) is robust across multiple independent datasets; the precise ratio is a calibration starting point, not physics.
Share of Search: The Honest Signal You’re Probably Ignoring
Surveys ask people what they think. Search data shows what they do. At the IPA’s EffWorks Global conference in October 2020, Binet presented six years of work on share of search — your brand’s share of organic Google queries within your category, a number you can pull from Google Trends for free, weekly, going back to 2004.
The findings held across three categories. Share of search correlates with market share, and more usefully, it leads it: in cars (23 brands, 2004–2015), search share moved up to 12 months ahead of market share; in mobile handsets, up to six months; in energy, up to three. Advertising feeds it too — ten extra points of share of voice lifted share of search by roughly 0.4 points immediately, and around six in ten searches traced back to long-term advertising effects that accumulate over about two years.
It’s not a crystal ball. Negative news also drives searches, price shifts break the conversion link, and the lead time varies by category. But as an un-gameable, behavioral, early-warning signal of consideration, it beats any quarterly survey you’re paying six figures for. Binet’s own framing: it measures what people are actually doing, not what they say they’re doing.
ESOV: The Voice Gap That Predicts Growth
One more instrument belongs in every brand plan: excess share of voice — your share of voice minus your market share. The classic Binet and Field finding across IPA Databank analyses: every 10 points of ESOV is associated with roughly half a point of annual market-share growth. The B2B Institute’s 2019 analysis of 1998–2008 cases found similar magnitudes — about 0.6 points for consumer brands, 0.7 for B2B — again with the authors’ own “tentative” label attached.
It’s a correlation with a budgeting superpower: it tells you what share of voice you need to buy to hit a share target, before you spend a dollar. Brands that spend above their size tend to grow; brands that spend below it tend to shrink. And the IPA’s own recent commentary adds a modern caveat — in a fragmented attention economy, raw voice matters less than the quality of attention it buys. Use ESOV as a planning lens, not a guarantee.
How to Build a Brand Measurement System That Diagnoses
Pulling it together, here’s the build:
- Track each currency separately. Unprompted recall and situation-based salience for awareness; consideration-set inclusion and share of search for preference; intent-to-purchase and conversion for action. Never one blended score.
- Report the transitions. Awareness-to-consideration conversion is your relevance diagnostic. Consideration-to-purchase is your trust-and-availability diagnostic. The unaided-aided spread is your memory-depth diagnostic.
- Lean on behavioral signals. Share of search and ESOV are cheap, fast and hard to fake. Surveys are slow, costly and noisy — panels drift, respondents satisfice, and a corrupt awareness number poisons everything downstream. Use surveys for why, behavior for whether.
- Match metric to horizon. Conversion moves in weeks; consideration in quarters; awareness in years. Give each its own review cadence, or impatience will erase the slow-compounding metrics — which are precisely the ones that protect next year’s revenue.
- Connect it to the business story. Gartner’s doom-loop research is blunt about the exit: regular brand-health measurement, linked to business outcomes, translated into a simple executive narrative. The C-suite isn’t anti-brand — 85% of CMOs in Gartner’s 2025 survey (about 400 respondents, February–March 2025) agreed brand investment drives business results, even while 54% prioritized performance marketing against just 22% prioritizing brand. They’re anti-unproven spending. Give them proof.
The AI Complication: Consideration Is Moving Inside the Model
One last wrinkle, and it’s a big one. As buyers shift their research into AI assistants, the shortlist increasingly forms inside the model’s answer, not in the buyer’s head. If ChatGPT or Gemini names three vendors and you’re not one of them, you may never make the day-one list at all — no matter how strong your aided recognition scores look.
That means brand measurement now needs a fourth lens: AI mention share and AI share of voice. Track which assistants name you, for which prompts, against which competitors. The old currencies haven’t disappeared — but a new exchange has opened, and it quotes prices while you sleep.
Conclusion: Read the Gaps, Not the Score
Brand measurement fails because we flatten three currencies into one number and then wonder why the number can’t tell us anything. Awareness is memory. Consideration is preference. Intent is action. The transitions between them are where brands actually live or die — and where every useful diagnosis hides.
The evidence gives you the playbook: plant with brand-building and harvest with activation, in a ratio calibrated to your category rather than copied from a headline; watch the honest signals — share of search, ESOV, transition rates — and give the slow metrics the patience their compounding deserves. Because the alternative has a name now, and a price tag: a doom loop that 84% of companies are stuck in, and a growth-target penalty for staying there.
Your dashboard doesn’t need another number. It needs the gaps between the three it already has.