The Silo Tax: What It Costs When Teams Don’t Talk
Here’s a scene you’ve probably lived. Marketing hits its MQL target. Sales hits its activity quota. Product ships on schedule. Finance closes the books on budget. Everyone’s dashboard is green — and yet the pipeline is thin, growth is flat, and the Monday meeting turns into a blame exchange about lead quality.
Nobody failed at their job. That’s exactly the problem.
Marketing stopped being a department years ago. It became a system — one that only works when product, sales, finance, and customer success move together. But most organizations still run it like a set of adjacent fiefdoms, and every boundary between them charges an invisible toll. Call it the silo tax: the rework, duplicated effort, and evaporated demand that happens between teams, not inside them.
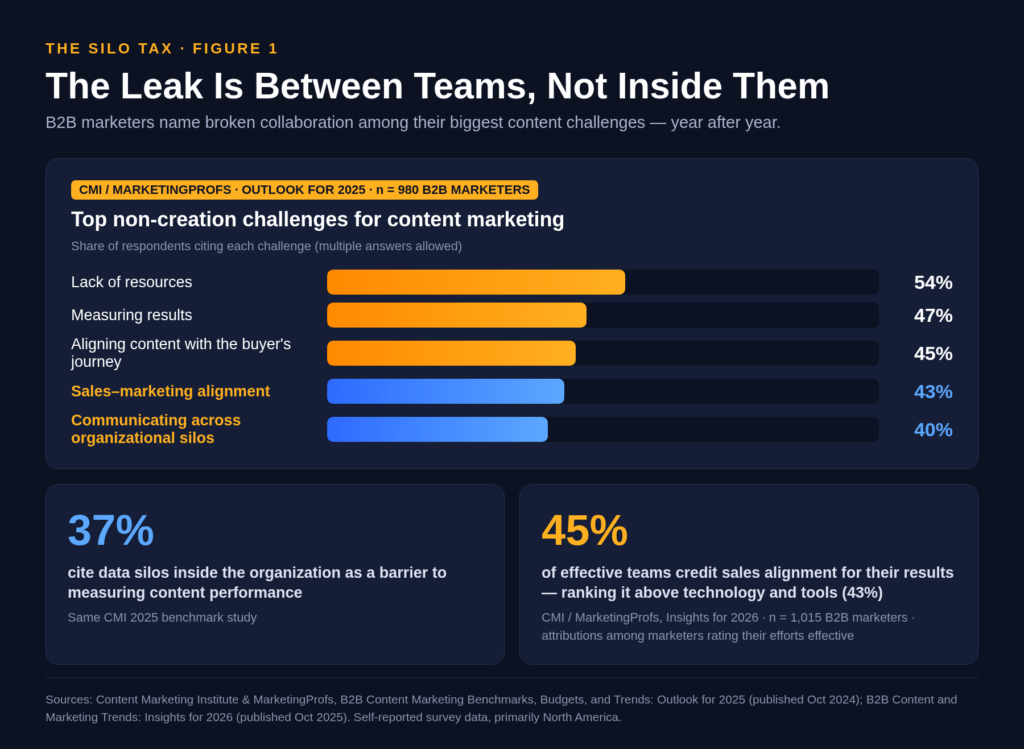
The evidence says this isn’t a soft, cultural complaint. In the Content Marketing Institute and MarketingProfs annual B2B benchmark for 2025 — a survey of 980 B2B marketers, mostly North American — aligning sales and marketing (43%) and communicating across organizational silos (40%) ranked among the top non-creation challenges, right behind resources, measurement, and buyer-journey fit. A further 37% named data silos inside the organization as a direct barrier to measuring content performance at all. The tax is real, it’s measurable, and you’re already paying it.
The good news? It’s an operating problem, which means it has an operating fix. Let’s break it down.
The Silo Tax, Defined: Death by a Thousand Handoffs
The silo tax is the invisible overhead of non-cooperation. It shows up in three currencies:
- Rework — campaigns rebuilt because the brief never traveled; positioning written twice because product and marketing never shared a room.
- Duplication — three teams buying three tools that do the same job, each with its own version of the customer.
- Evaporated demand — qualified buyers who raised their hand and then died in the gap between “marketing qualified” and “sales accepted.”
Notice what’s missing from that list: bad people. The silo tax isn’t a personnel problem. It’s what happens when every team rationally optimizes its own KPI while nobody owns the space between the KPIs. Marketing is paid on lead volume, sales on closed deals — so marketing ships volume, sales ignores it, and both sides can prove they did their job while the revenue leaks out through the seam.
If you remember one thing from this piece, make it this: the leak is in the handoffs, and handoffs are design decisions. Which means you can redesign them.
The Four Silos That Tax Marketing Most
Marketing ↔ Sales: The Handoff Silo
The classic. Two teams, two definitions of “qualified,” two incentive systems, one shared pipeline that neither fully owns. The speed problem alone is brutal: a Harvard Business Review audit of 2,241 U.S. companies — published in 2011, and still the canonical benchmark because so little has improved — found that firms responding to a web lead within an hour were nearly seven times more likely to qualify it than those waiting one hour longer, and over sixty times more likely than those waiting a day. The average response among companies that responded at all? Forty-two hours. And 23% never responded. Ever. (Honesty note: the 42-hour figure counts only responders — the true picture is worse — and the 7x multiplier comes from a smaller companion observation study, so treat these as correlations, not laws of physics.)
Fifteen years later, leads still rot in CRM queues nobody owns. That’s not a sales failure or a marketing failure. It’s a handoff nobody designed.
Marketing ↔ Product: The Message Silo
Marketing sells a story product hasn’t shipped. Product ships features marketing never learned to position. Both teams are competent; neither brief travels. The fix is unglamorous: a shared roadmap review and a positioning brief that both teams sign before anything goes public.
Marketing ↔ Finance: The Language Silo
Marketing speaks campaigns; finance speaks P&L. When budget season arrives, the team that can’t translate its work into revenue language gets cut — not because its work lacks value, but because the value never got translated. The budgets tell the story of what gets funded instead: in CMI’s 2026 outlook (1,015 B2B marketers surveyed), AI tools topped the planned investment list at 45%, while human resources — salaries, training, development — sat dead last at 9%. We’re buying sharper instruments and skipping the musicians.
Marketing ↔ Customer Success: The Feedback Silo
Customer success sits on the richest vein of customer truth in the building — churn signals, real objections, the reasons deals actually renew — and in most companies that insight never flows back to acquisition. Close this loop and you attack CAC and churn with the same move. Leave it open and marketing keeps buying customers that CS already knows won’t stay.
Buyers Left the Funnel. Your Org Chart Didn’t Notice.
Why does the silo tax matter more now than it did five years ago? Because the journey it taxes has changed shape.
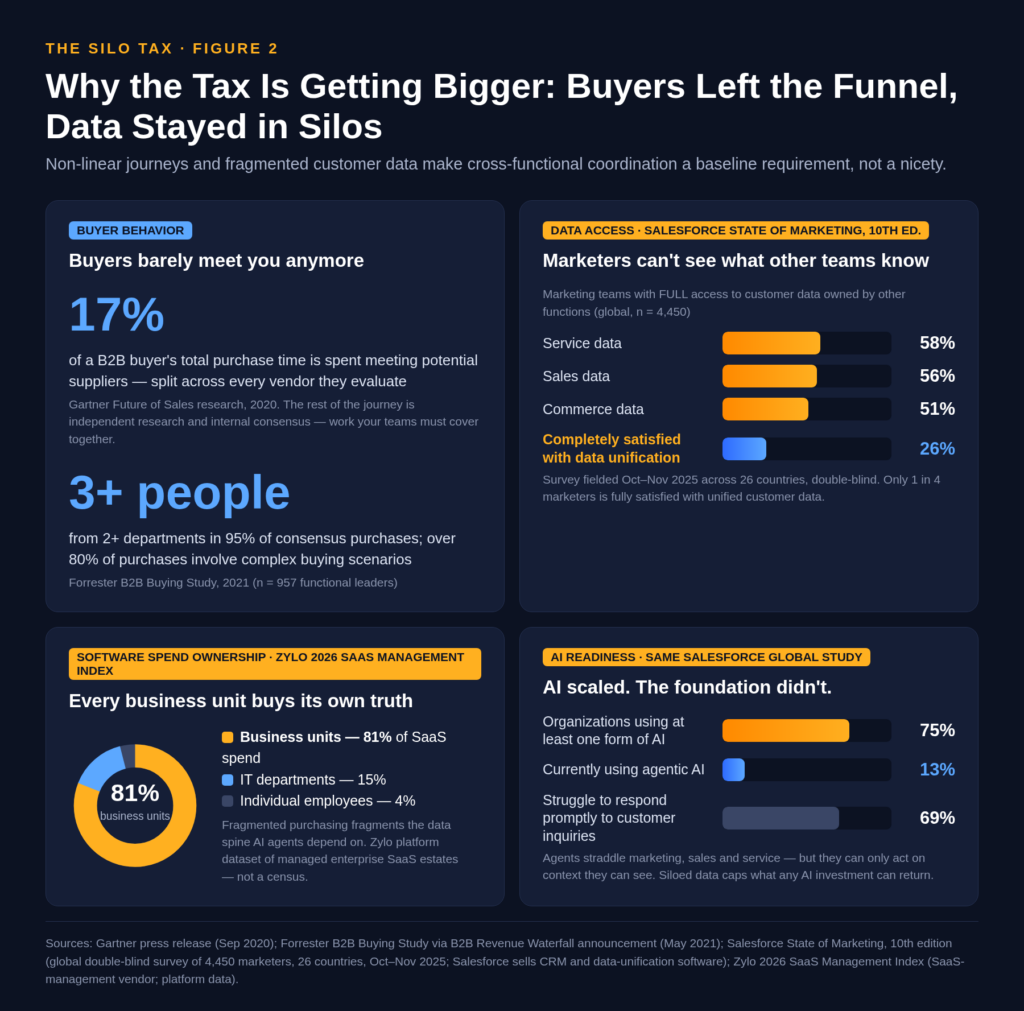
Gartner’s Future of Sales research found that B2B buyers spend only about 17% of their total purchase time meeting potential suppliers — and that slice gets split among every vendor in the running. The other 83% is independent research and internal consensus-building, much of it now conducted with AI assistants that don’t care about your departmental boundaries. (Gartner also predicted in 2020 that 80% of B2B sales interactions would be digital by 2025 — a forecast, not a measurement, but the direction has held.)
Meanwhile, Forrester’s 2021 B2B Buying Study found that more than 80% of purchases involve complex buying scenarios, and in consensus scenarios, 95% of purchases involve three or more people across two or more departments. Read that again: your buyer is a cross-functional committee. If your own organization can’t operate cross-functionally, you’re bringing a relay team to a committee fight.
And customers feel every seam. Salesforce’s State of the Connected Customer research (sixth edition, 2023; 14,300 consumers and business buyers worldwide) found that 79% of customers expect consistent interactions across departments — yet 55% say it generally feels like they’re communicating with separate departments rather than one company. Salesforce sells the software that fixes this, so weigh the source accordingly; but the finding matches what any of us who has re-explained a support issue to a salesperson already knows.
A siloed org can’t cover a non-linear journey. The buyer experiences one company. The org chart says otherwise. The difference is the tax.
AI Just Raised the Stakes on Every Handoff
Here’s the 2026 twist: the systems that were supposed to connect your teams now depend on your teams being connected.
Salesforce’s tenth-edition State of Marketing report — a double-blind global survey of 4,450 marketers across 26 countries, fielded October–November 2025 — found that three-quarters of organizations now use at least one form of AI, but only 13% have deployed agentic AI. Why the gap? Context. An agent can’t resolve a customer issue it can’t see, or recommend a next step based on a service history it can’t read. And the data says most can’t: only 58% of marketing teams have full access to service data, 56% to sales data, 51% to commerce data. Just 26% of marketers are completely satisfied with how their customer data is unified. (Again: Salesforce sells the unification layer, so read the framing with that in mind — but the survey is double-blind and the sample is large.)
The purchasing data explains why the fragmentation persists. Zylo’s 2026 SaaS Management Index — built from the SaaS estates its platform manages, so large-enterprise-weighted, not a census — found that business units now control 81% of SaaS spend, with IT directly managing just 15% and individual employees expensing another 4%. Every department buys its own tools, which means every department grows its own version of the customer.
So the AI era doesn’t forgive silos; it compounds them. Point an agent at fragmented data and you don’t get personalization — you get automated inconsistency at scale. Cross-functional data governance used to be hygiene. Now it’s the ceiling on your entire AI investment.
The Prize: What Aligned Teams Actually Get
Before the fix, the payoff — because “align your teams” is easy to nod at and hard to prioritize without a number attached.
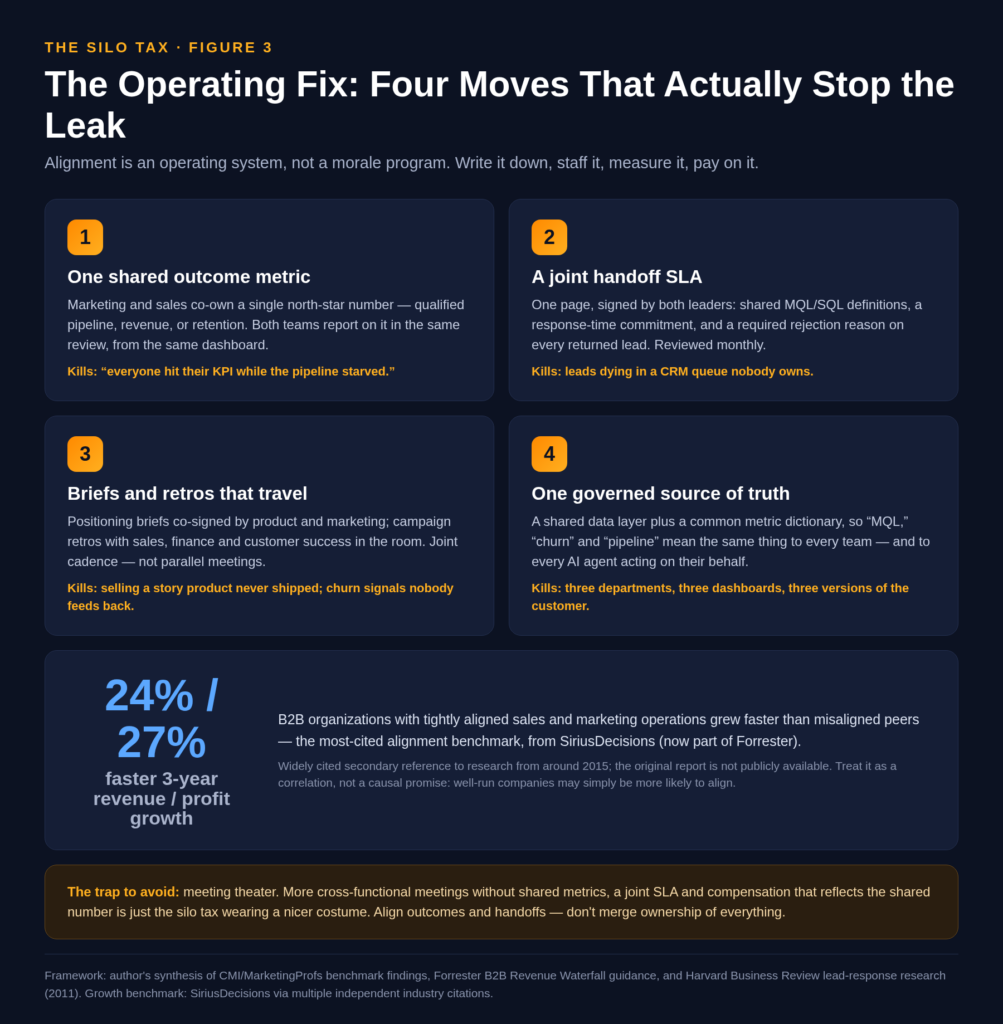
The most-cited benchmark comes from SiriusDecisions (the B2B research firm now part of Forrester): organizations with tightly aligned sales and marketing operations achieved 24% faster three-year revenue growth and 27% faster three-year profit growth. Fair warning: this finding dates to research from around 2015, circulates through secondary citations, and describes a correlation — well-run companies may simply be more likely to align. Don’t promise your CFO 24%. But the direction is corroborated by fresher data: in CMI’s 2026 study, marketers who rated their efforts effective credited alignment with sales (45%) more often than technology and tools (43%) — trailing only content quality and team skills.
That ordering matters. The industry is spending its incremental budget on tools (45% planning to increase AI spend) while the effective teams keep saying the edge comes from people working together. The silo tax is the gap between where the money goes and where the results come from.
Fix One: One Shared Number Both Teams Own
The first move is metric design. Pick one joint north-star — qualified pipeline, revenue, or retention — that marketing and sales co-own, report on in the same review, from the same dashboard.
Not adjacent goals. Not “marketing supports sales.” A single number with two names on it. The moment marketing’s success is defined by what happens after the handoff, lead volume stops being a trophy and starts being a means. And the moment sales is measured partly on pipeline hygiene — accepting, rejecting with reasons, feeding back — the “marketing sends us junk” complaint becomes a shared debugging problem instead of a turf war.
One caution from practice: shared metrics only bite when compensation reflects them. A shared number nobody is paid on is a dashboard decoration. More on that trap below.
Fix Two: A Joint SLA for the Handoff
The marketing-to-sales handoff needs a contract, not a vibe. One page, signed by both leaders, covering three things:
- Shared definitions. What scoring criteria and firmographic fit make an MQL; what acceptance criteria make an SQL. Written down, visible in the CRM, identical for both teams.
- A response-time commitment. How fast a routed lead gets first human touch — with a named owner and a fallback for off-hours. If the HBR decay curve is even directionally right, hours matter more than almost anything else on this page.
- A mandatory feedback loop. Every rejected lead carries a reason code back to marketing. Those rejection reasons are the training data that makes next month’s scoring smarter. Review them monthly, together.
This is also where Forrester’s revenue-waterfall thinking earns its keep: measure conversion between stages, not just volume at each stage. A funnel report that shows 500 MQLs and says nothing about acceptance rates is a silo-tax receipt.
Fix Three: Briefs and Retros That Travel
Alignment lives in artifacts and rituals, not intentions. Two practical vehicles:
- Briefs that travel. Positioning briefs co-signed by product and marketing before launch; campaign briefs that name the sales motion they feed. If a brief can’t cross a department boundary intact, it isn’t finished.
- Retros that include both sides. Campaign retrospectives with sales in the room; quarterly reviews where customer success brings churn reasons and objections back to acquisition. Joint cadence — the same meeting, not parallel meetings that exchange slides afterward.
Keep the ritual count honest. The point is a small number of recurring, decision-producing interactions with named owners — not a standing committee for every seam. If your cross-functional calendar keeps growing while nothing gets decided, you’ve built meeting theater, and we’ll get to that.
Fix Four: One Governed Source of Truth
The data fix has two halves, and you need both.
The first is a shared data layer: one governed view of the customer that marketing, sales, service, and commerce all read from and write to. Given that only about a quarter of marketers are fully satisfied with their data unification, this is a multi-quarter program, not a purchase order.
The second is cheaper and gets skipped constantly: a common metric dictionary. What counts as an MQL, an opportunity, churn, pipeline coverage — defined once, versioned, owned by someone. When “pipeline” means three different things in three different decks, no dashboard can save you, and neither can any AI agent acting on those definitions.
The Traps: Meeting Theater and Alignment Overkill
Four honest caveats, because every operating fix has a failure mode.
Meeting theater. More cross-functional meetings without shared metrics and a joint SLA is just the silo tax wearing a nicer costume. Audit before you add: every new ritual should replace or shrink an old one.
Alignment overkill. Forcing every team into every decision doesn’t break silos; it breaks speed. Align outcomes and handoffs — don’t merge ownership of everything. Specialization exists for good reasons: different rhythms, different risk tolerances, different crafts. The goal is free-flowing handoffs between specialists, not one undifferentiated team.
Incentive incompatibility. If sales comp is 100% closed-won and marketing comp is 100% MQL volume, your shared dashboard is fiction. Somebody with authority over both scorecards has to move a meaningful slice of each team’s incentives onto the shared number. This is the step most alignment programs quietly skip, and it’s the one that decides whether the other three stick.
The measurement lag. Shared outcome metrics move slowly. Pipeline quality improves months before revenue does. If you judge the program on a quarterly revenue print, you’ll kill it right before it works. Track the handoff metrics — acceptance rate, response time, rejection reasons — as your leading indicators.
Run the Handoff Audit Before You Buy Anything
You don’t need a reorg or a new platform to start. You need one afternoon and three numbers:
- Submit a test lead through your own website from a personal email address. Time the first human response. You now know which side of the HBR distribution you’re on.
- Pull 90 days of MQLs and compute the acceptance rate, median time-to-first-touch, and the share of rejected leads carrying a reason code. Most teams discover the reason-code share is near zero — the feedback loop doesn’t exist.
- Ask five managers to define “qualified lead.” If you get five definitions, you’ve found your first fix, and it costs a two-hour working session, not a software contract.
Then sequence the fixes: definitions and SLA first (weeks), shared metric and comp adjustment next (a quarter), governed data layer last (a program). Break the silo tax in that order, and the growth you were paying to lose in the handoffs starts compounding instead.
Your marketing isn’t failing. Your seams are. Seams can be sewn.