Mentioned, Clicked, Bought: The Three AI-Search Funnels, and the One You Keep Measuring
Mentioned, Clicked, Bought: The Three AI-Search Funnels, and the One You Keep Measuring
Ask an assistant to recommend a CRM for a twelve-person sales team. It answers with three names, one line of reasoning each. You click one, land on a pricing page, and buy.
Three things just happened. They were not three steps of a single funnel.
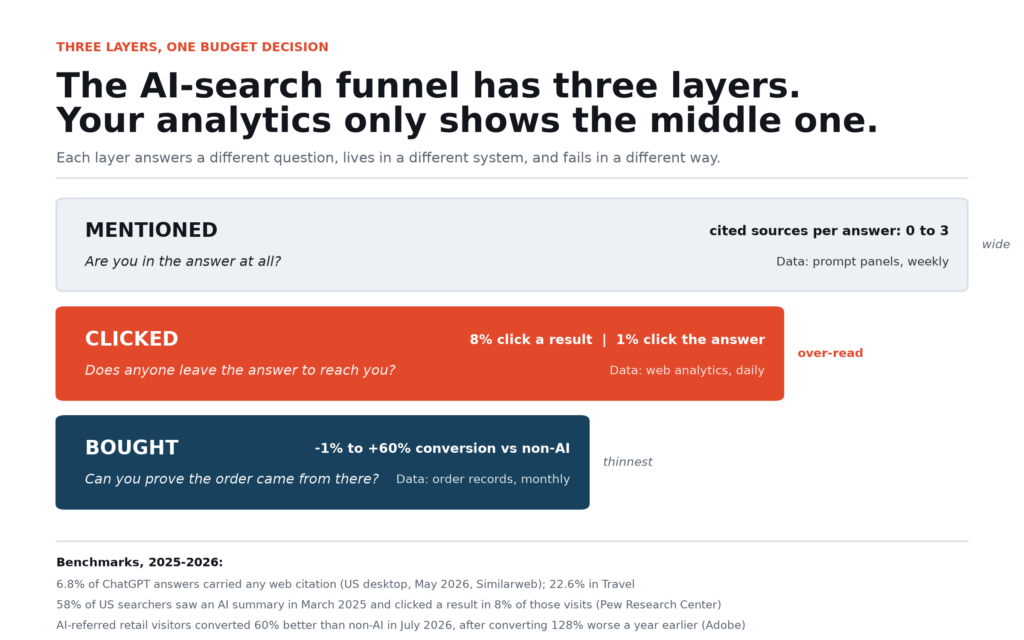
They were three different systems, with three different owners, three different data sources, and three different ways of lying to you. The first decides whether you exist in the answer at all. The second decides whether anyone leaves the answer to find you. The third decides whether you will ever be able to prove the order came from there.
Most marketing teams spend their AI budget on the second one. Not because it matters most, but because it is the only layer that shows up in a dashboard they already pay for. The first layer lives in tools they have not bought, and the third lives in spreadsheets nobody has built yet. So the middle layer gets the attention, the debate, and the blame.
The short version
- Mentioned is a citation-share problem. You are competing for one of a handful of slots inside an answer that may not cite anything at all.
- Clicked is a measurement problem. The conversion premium is real and has recently inverted in AI’s favour. The famous numbers are shakier than they look.
- Bought is an attribution problem, and it is the one that will cost you money, because the transaction is moving inside the assistant.
- The objection that AI traffic is too small to matter is half right. The volume is small. The ratio is not, and the decision it feeds has already been made three screens earlier.
1. Three layers, three systems
Draw the funnel and it looks continuous. Operationally it is three disconnected pipes.
| Layer | The question it answers | Where the data lives | Who owns it | Refresh rate |
|---|---|---|---|---|
| Mentioned | Are we in the answer? | Prompt panels, answer scraping, citation logs | Content, brand, SEO | Weekly |
| Clicked | Does anyone leave the answer? | Web analytics, server logs, referrer records | Analytics, growth | Daily |
| Bought | Did the order come from there? | Order records, CRM, promo codes, holdout tests | Finance, ecommerce, RevOps | Monthly |
None of these three systems was designed to talk to the others. The prompt panel samples questions. The analytics tool counts sessions. The order system counts money. Between them sit two joins that no vendor sells you as a product: question to session, and session to order.
A concrete consequence: your AI visibility can double while your attributed AI revenue falls, and both statements can be true. The panel got better. The attribution got worse. Nobody’s dashboard shows both numbers side by side, so nobody notices.
In one line: treat the AI funnel as three products with three owners, not one channel with one KPI.
2. Mentioned: you are bidding for a slot, not a position
Search gave you a ladder. Answers give you a shortlist.
When an assistant cites anything, it cites very little. Pew Research Center’s analysis of US browsing behaviour collected the AI summaries shown on Google results in March 2025 and recorded up to three source URLs per summary. That is the entire addressable surface for a mention: not page two, not position eleven. Three slots, sometimes.
It gets narrower. In May 2026, only 6.8% of ChatGPT conversations in the US included web citations at all on desktop, averaged across every category. Travel was the outlier at 22.6%, because travel questions are the kind that need a live handoff to a booking page. Similarweb, which ran that measurement across its panel, counts roughly 770.7 million AI referral visits a month worldwide between June 2025 and May 2026 — more than double the year before, but still arriving through a citation door that is mostly shut.
So the arithmetic of the first layer is unusual. You are not optimising for rank. You are optimising for the probability of being selected into a three-item list, on question sets where the assistant has decided, or not, to quote anyone.
Three practical implications follow.
Your unit of work is a question cluster, not a page. A page can be cited for forty different questions, or for none. Track the questions.
Rank correlation survives, weakly. Pages that rank also tend to be cited, because retrieval and ranking read similar signals. But the correlation is loose enough that a top-three organic position guarantees nothing inside the answer.
The academic evidence is encouraging and modest. The Generative Engine Optimization paper from Princeton and collaborators, published at KDD 2024, measured visibility gains of up to 40% from content interventions such as adding citations and statistics. Forty percent is a real effect and a bad slogan. Nobody is getting four times the citations by rewriting their headings.
The bottleneck is measurement, not content. Semrush’s 2026 AI Visibility Index analysed 126 million US AI search prompts from January to April 2026 across 22 industries, and found that 45% of marketing leaders cannot accurately measure their brand’s visibility inside AI answers, while only 9% say they have the tools to track all relevant metrics across platforms. A share-of-citations number you cannot defend is worse than no number, because it will be quoted in a budget meeting.
What to measure here: citation share across a fixed panel of buyer questions, weekly, with the number of prompts and the number of runs per prompt stated next to the percentage.
3. Clicked: the premium is real, the famous number is not
This is the layer everyone argues about, usually with a number they cannot trace.
Start with what people do after reading an answer. Pew’s browsing study is the cleanest behavioural evidence available: users who encountered an AI summary clicked a traditional search result in 8% of visits, against 15% for visits with no summary. They clicked a link inside the summary itself in 1% of visits. And they ended the browsing session entirely on 26% of pages with a summary, against 16% without. The click does not disappear because people stopped wanting things. It disappears because the answer arrived first.
Then the conversion premium, where the story splits in two.
The optimistic side, at scale. Adobe’s analysis of AI-referred traffic to US retail sites covers more than a trillion visits. In July 2026, AI-referred retail visitors converted at a rate 60% higher than non-AI traffic, up from 54% in May, and generated 53% more revenue per visit. They bounced 34% less, spent 59% longer on site, and added to cart at a 28% higher rate.
The part almost nobody quotes is what the same series said a year earlier. In July 2025, non-AI visits were worth 128% more than AI visits. The gap did not close gradually. It inverted. That single fact explains most of the disagreement in this field.
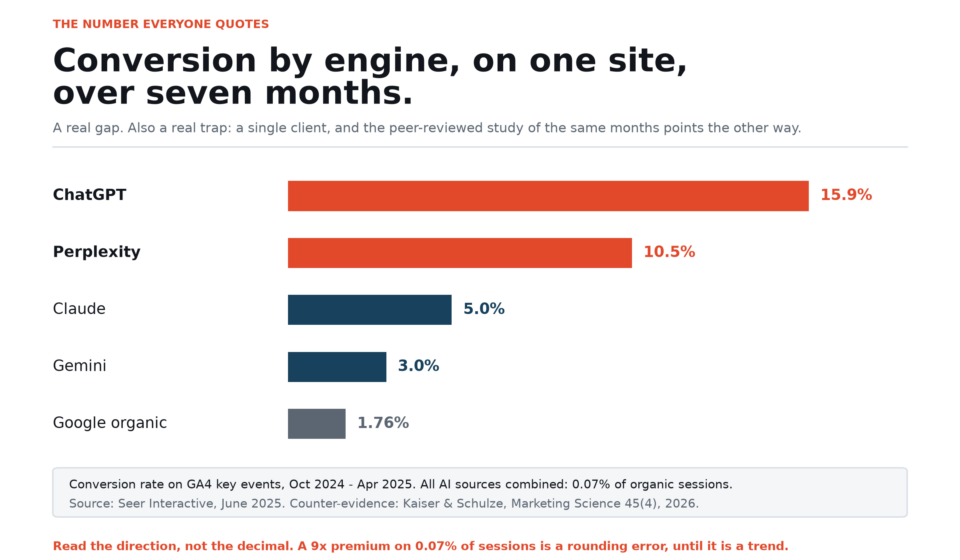
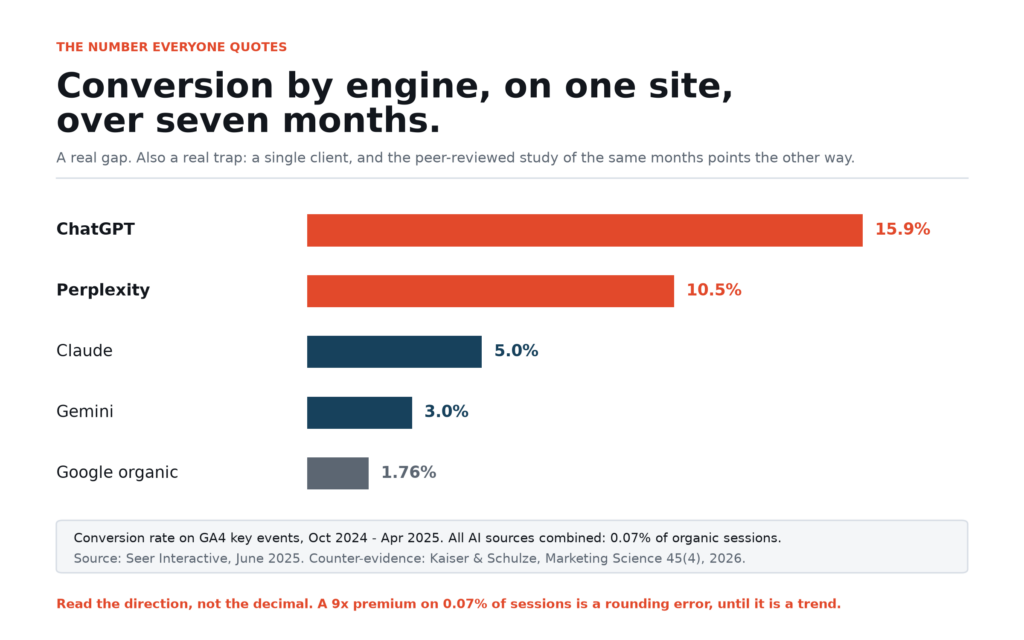
The sceptical side, peer-reviewed. Kaiser and Schulze, published in Marketing Science in 2026, analysed twelve months of first-party data from 973 ecommerce sites with $20 billion in combined revenue, August 2024 to July 2025: more than 50,000 transactions from ChatGPT referrals against 164 million from traditional channels. ChatGPT referrals converted worse than every major channel except paid social, with affiliate traffic showing roughly 86% higher log-odds of conversion and organic search about 13% better. ChatGPT accounted for under 0.2% of sessions. Three of their four trend models projected no parity with organic search within a year.
Both are credible. Both are correctly calculated. They disagree because they measured different things at different times.
Four mechanisms do most of the reconciling.
The window matters most. The peer-reviewed study ends in July 2025, precisely where Adobe’s series puts AI traffic at its weakest relative to other channels. The crossover happened after that dataset closed.
The denominator differs. Adobe measures session-level conversion on tagged referrals. The academic study measures transactional outcome per referred session across a twelve-month book. Short windows flatter high-intent moments; long windows absorb the returns, the abandoned carts, and the second purchase that arrives from another device.
Composition confounds both. A retailer whose AI traffic is 80% product-comparison questions will beat one whose AI traffic is 80% brand-navigation questions, because one arrives with a shortlist and the other arrives curious.
And visibility differs. Tagged referrals are the ones that announced themselves. Every measurement of this channel is a measurement of the polite half.
Now the two numbers you have probably seen.
The 11× figure circulates as “AI traffic converts eleven times better than organic search”. Traced back, it comes from a vendor’s own panel comparing AI-attributed sign-ups with an organic baseline, where the AI sign-up rate sat near 1.66%. A panel measurement, no external audit, published by a company that sells AI traffic analytics. That does not make it false. It makes it a hypothesis with a market.
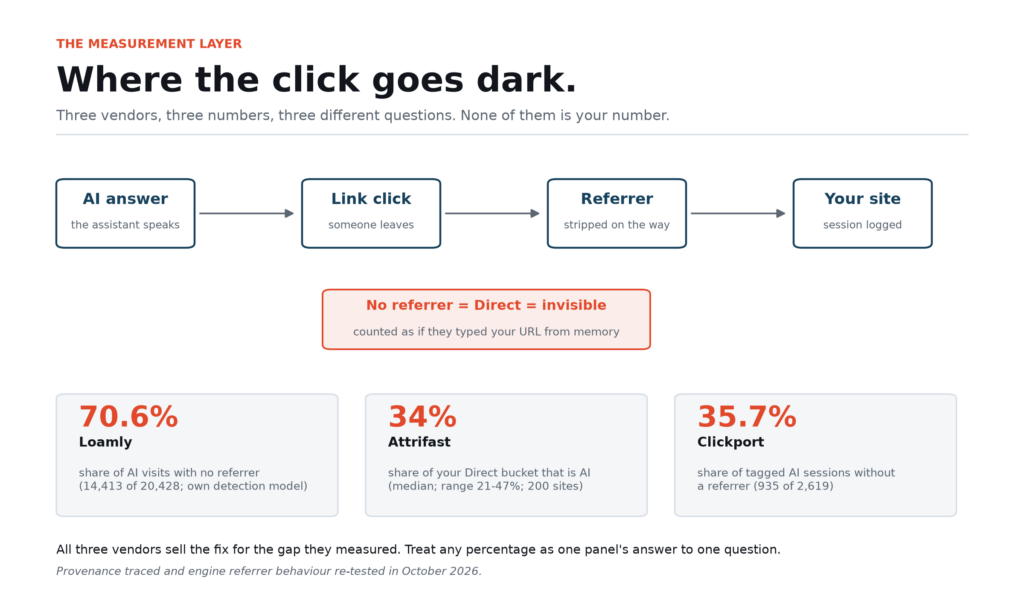
The 70.6% figure is more instructive, because it usually answers a question nobody asked. It comes from one vendor’s detection model across roughly 446,000 visits, where 14,413 of 20,428 recognised AI visits arrived with no referrer at all. Two other vendors measure the neighbouring question — how much of your Direct bucket is probably AI — at 34% median, range 21% to 47%, and at 35.7% of tagged AI sessions missing a referrer. Three numbers, three questions, one shared incentive: all three sell the fix.
In one line: the click layer is thin, real, and measured with error bars wider than the effect most brands are trying to detect.
4. Bought: attribution dies where the transaction completes
For twenty years, a purchase left a trail: a referrer, a cookie, a session, an order, a row in a database. The trail is being cut in the middle, by design.
Checkout is moving inside the assistant. OpenAI’s Instant Checkout lets a purchase complete inside ChatGPT, built on the Agentic Commerce Protocol — an open standard codeveloped with Stripe and since broadened to other platforms — so an agent can transact with a merchant without the buyer ever loading the merchant’s site. Google has been building the equivalent rails for its own surfaces. Forrester’s mid-2026 assessment calls agentic commerce early but structurally real. Early is the operative word, and also the reason to instrument now rather than later.
Advertising has followed the same path. OpenAI began testing ads in ChatGPT in the US in February 2026, opened a self-serve Ads Manager in July, and added new formats and attribution partnerships through the autumn. Wherever the answer goes, the auction goes. That is a reasonable bet on where attention sits, and it predicts the next twelve months of measurement: the platforms now have a commercial interest in proving their referrals convert, which means better attribution plumbing and more generous default reporting, arriving together.
Four specific breaks matter to you.
No referrer, no cookie. Links arriving from a mobile app’s in-app browser often carry no referrer at all. The order still happens. Your analytics sees a direct visit and files it under “typed the URL from memory”, which is a polite fiction.
Device switching. Adobe’s consumer survey found 66% of consumers visit a brand’s site directly to verify an AI recommendation, and 89% say they click links or sources an assistant gives them. Reassuring for anyone who feared AI killed the click. Also a description of a journey that starts on a phone, continues on a laptop, and ends in an order with no memory of where it began.
The transaction completes elsewhere. When checkout happens inside the assistant, the merchant receives an order with a delegated payment credential and very little narrative. You can see revenue. You cannot see the question that produced it.
Ads and organic answers share a surface. Once sponsored placements sit under an answer, incrementality gets harder to isolate, because the same user in the same conversation may see both.
The practical answer is not better web analytics. It is order-level matching plus a counterfactual: promo codes reserved for assistant-referred traffic, one optional “how did you hear about us” field at checkout, geo holdouts, and eventually marketing mix modelling with AI visibility as a regressor. None of it is glamorous. All of it survives a finance review.
In one line: you cannot attribute what you cannot observe, and the transaction is moving to a place your tag manager cannot reach.
5. The engines do not behave like one channel
Blending them is the fastest way to be wrong on purpose.
The population mix first. In the academic dataset covering 2024–2025, ChatGPT took over 90% of organic LLM sessions, with Perplexity at 4.1%, Gemini at 2.6% and Copilot at 2.1%. Seer Interactive’s single-client analysis found a different split in its window — roughly 61% ChatGPT, 24% Perplexity, 15% Gemini — and Similarweb’s 2026 panel still puts ChatGPT above 80% of referral traffic to the top 1,000 global domains, even as its share of AI traffic erodes.
Behaviour differs as much as volume. In the same single-client data, ChatGPT visitors averaged 2.3 pages per session against 1.2 for Google organic, while Gemini conversions clustered on calculators and practical tools, visitors arriving with one task and no interest in browsing. Engagement rates across all AI sources landed in a 58% to 62% band, unremarkable on its own; page depth is where the difference showed.
Then there is the surface with no click at all. Google says AI Mode passed a billion monthly users in 2026. Most of those sessions end inside the answer. A brand can be mentioned, believed, and never visited.
In one line: report per engine and per surface, or accept that a mix shift will masquerade as a performance change.
6. One composite metric that survives contact with a CFO
Each layer alone is too noisy to budget against. Multiply them and you get something a finance team can argue with.
AI-sourced incremental revenue per 1,000 tracked prompts per month.
The calculation, in the order you can defend it:
- Mention share — percentage of panel prompts where you appear, averaged across runs.
- Click rate per mention — sessions from that engine divided by estimated mentions. Estimate mentions from the panel, not from traffic.
- Conversion premium — observed AI-referred conversion divided by your blended site rate.
- Average order value — engine-specific where you have the volume, blended where you do not.
- Counterfactual subtraction — the share of those orders that would have happened anyway. Start with a holdout or a promo-code split; refine later.
The output is unglamorous and useful: revenue per 1,000 prompts. It moves when content improves, moves when the engine mix shifts, and collapses honestly when you cannot prove incrementality. It also lets you compare two very different investments — a content programme and a bid on sponsored placements inside the same answer.
A second number earns its place as a diagnostic: the citation-to-click ratio. High citations with few clicks means you are being used as evidence rather than as a destination. That is a content problem, not a distribution problem.
7. Instrumentation: server-side, UTM, and a prompt panel
Three workstreams, in parallel, each boring on purpose.
Server-side capture. Log the referrer header at the origin, before JavaScript or a consent banner interferes, on every request. Build an assistant-host list — chatgpt.com, chat.openai.com, perplexity.ai, gemini.google.com, copilot.microsoft.com, claude.ai, and the rest — and classify on hostname rather than on a channel grouping you did not write. Check the unclassified share monthly. If Direct grows while brand search stays flat, you are looking at the polite fiction.
UTM discipline, with honest limits. You control the links you publish, not the ones an assistant generates. Where you can publish a trackable destination — your own documentation, a partner listing, a directory profile — tag it. Inside assistant surfaces you do not control, tag the destination instead: a distinct landing path per published source, an engine-specific promo code, a first-touch parameter set server-side. Do not assume an assistant will append anything for you. Test it quarterly and write down what you find, because it changes.
A prompt panel. Forty to a hundred buyer questions per category, phrased the way buyers type them, run weekly across four to six engines. For each run, record: were you mentioned, were you cited, did the answer include a link, at what position in the list, and who else appeared. Store the raw answers. Sampling variance is large at this scale, so the panel is only useful if it stays fixed and if you report the number of runs.
Add one cheap qualitative instrument: a single optional field at checkout asking how the customer first heard about you. Crude, self-reported, biased toward the memorable. Also the only signal that survives a device switch.
In one line: if your AI reporting depends entirely on a vendor’s fingerprinting, you are renting your own history.
8. Metrics to ignore, and what to watch instead
Some numbers are worse than absent, because they create confidence.
Ignore AI impressions. Nobody has agreed on what one is, and platforms do not report them consistently. An appearance inside a conversation that may have been abandoned at the first sentence is not an impression.
Ignore “we rank number one in ChatGPT”. There is no rank. There is a list, regenerated per conversation, sensitive to phrasing and to the day’s retrieval. A screenshot is an anecdote.
Ignore share of voice without a denominator. If a share-of-voice number arrives without a stated prompt set, a stated run count and a stated engine list, it is decoration.
Ignore blended AI traffic totals. Averaging across engines hides the only thing that changed.
Ignore dark-traffic percentages quoted as facts. The 70.6%, the 34%, the 35.7%: each is one panel’s answer to one question, from a vendor with a product to sell. Use them as priors, not as measurements of your site.
Watch instead: citation share on a fixed panel; click rate per mention; conversion premium by engine; attributed share of AI-sourced revenue; and the ratio of tagged to untagged AI sessions — your measurement debt expressed as a number.
9. A worked example with numbers you can check
Take a mid-market retailer with a million sessions a month.
AI referrals at 1.2% of sessions is 12,000 visits. An AI conversion rate of 2.1% against a site-wide 1.4% gives 252 orders, against the 168 you would expect from an average visit: 84 incremental orders. At an average order value of $85, that is roughly $7,140 a month in incremental revenue before returns.
Now the honest part. If a third of AI visits never announced themselves, the real session count is closer to 18,000 and the real order count closer to 378. The reported conversion rate does not change. Revenue per session does not change. Only the size of the prize changes, by 50%.
Now the content side, which is where most of this breaks down. A hundred-prompt panel run four times a week is about 1,700 runs a month; at an 18% mention rate you appear in roughly 300 answers. Those answers reach an audience vastly larger than the panel, so the panel cannot count clicks. Its job is to give you a rate you can apply to traffic. Set the two against each other: if 12,000 sessions implies 4,000 mentions a month, and the panel says 18% of questions mention you, the implied question volume is about 22,000 a month. If that number looks implausible for a mid-market retailer, one of your two measurements is wrong — and finding out which is worth more than the revenue estimate.
The lesson is not the arithmetic. It is that doubling the panel is cheaper than doubling the spend, and the panel tells you which lever to pull.
10. Category benchmarks, and the caveats attached
Numbers travel badly between verticals, so here is what the large datasets say.
Retail. AI-referred traffic grew 62% year over year in July 2026, conversion ran 60% above non-AI, revenue per visit 53% above, bounce 34% lower. The category with the most data is also the one with the shortest funnel, which flatters the premium.
Travel. Traffic grew 119% year over year, and the conversion gap narrowed to 1%: AI-referred traffic still converts marginally below non-AI, but its conversion rate rose 16% year over year while non-AI fell 38%. Travel is where the handoff is most natural and citation rates are highest — 22.6% of ChatGPT answers included citations in May 2026.
Financial services. Traffic grew 31% year over year. Lower growth, longer consideration, more compliance friction inside the answer. Expect mentions well before clicks.
Marketplaces. The largest volume in Similarweb’s panel, at 46.8 million average monthly AI referral visits, still growing 237% year over year. Volume leadership and growth leadership rarely coincide; here they do.
B2B software. Thinnest public data, longest cycle. Treat every consumer benchmark as an upper bound, and expect your first ninety days to produce directional signals rather than significance.
One caveat cuts across all of them: in the academic dataset, the performance gap was systematically worse for the largest sites. If you are a category leader, your AI traffic may look weaker than the benchmark, and that is a composition effect worth understanding before it becomes a budget cut.
Content readiness is measurable too, and Adobe scores it per page type. Apparel leads overall citation readability at 76%, electronics at 70%, grocery at 59%. By page type, editorial scores highest — electronics blogs and news pages at 85% — while booking, checkout and account flows score lowest everywhere. Structured, informational pages get cited. Transactional pages do not.
11. What good looks like
A scorecard with thresholds chosen so that failure is visible early.
| Signal | Weak | Workable | Strong |
|---|---|---|---|
| Citation share on your panel | under 10% | 10–25% | above 25% |
| Citation-to-click ratio | above 20:1 | 10–20:1 | under 10:1 |
| Conversion premium vs blended site | under 1.0× | 1.0–1.3× | above 1.3× |
| Attributed share of estimated AI revenue | under 40% | 40–70% | above 70% |
| Untagged share of AI sessions | above 50% | 25–50% | under 25% |
Two things to notice. None of these is a traffic target: volume is an output, and in this channel the least stable one you have. And the last row is the one most teams fail, while being the cheapest to fix.
12. The 90-day validation plan
Ninety days is enough to learn something and not enough to prove everything. Plan accordingly.
Days 1–30: make the invisible visible. Server-side referrer logging on. Assistant host classification built and reviewed by hand for a week. A custom channel group that does not collapse everything into Direct. Checkout question live. Baseline the last twelve months of Direct and brand search, because that is your control group.
Days 31–60: build the panel and the counterfactual. Write the prompt set. Run it weekly, store raw answers. Launch one clean incrementality test: a geo holdout, or a promo code offered only through assistant-referred landings. Pick one. Two half-tests produce two unusable results.
Days 61–90: read it honestly. Report citation share with its run count. Report click rate per mention. Report the premium with a confidence interval, and if the interval spans 1.0, say so. Then choose from three positions: invest in content for the questions you are missing from, invest in measurement because you still cannot see half the channel, or wait a quarter because the volume does not justify either.
Write down your kill criteria before you start. A channel that cannot clear them in ninety days is not a channel, it is a hobby.
The three-layer test, in one paragraph: if you can name the questions where you are cited, the share of those mentions that become sessions, and the share of those sessions you can trace to an order, you have a funnel. If you can name only the third number, you have a traffic report with an opinion attached.
Summary
The AI-search funnel is three systems wearing one name. Mention is a citation-share contest inside an answer that often cites nothing. Click is a thin, real, badly measured stream where the conversion premium has only recently turned positive and where every published percentage comes with a vendor attached. Purchase is moving inside the assistant, where the trail ends and attribution must be rebuilt from order records, promo codes and holdouts rather than cookies.
The “AI traffic is too small” objection is right about volume and wrong about consequence. Under 0.2% of sessions in one peer-reviewed dataset; 1.2% in a plausible mid-market case; growing 62% to 119% year over year depending on category, and roughly doubling every twelve months worldwide. Small streams are fine. What is not fine is a small stream you cannot see, cannot trace, and cannot price — while the decision it feeds was made three screens earlier.
FAQ
Does a click from ChatGPT show up as a referral in GA4?
Sometimes, and less often than you expect. Arriving from a desktop browser with the referrer intact, it is classified as a referral. Arriving through an in-app browser or a stripped link, it lands in Direct. Check your own logs by hostname rather than trusting a channel grouping, because the split varies by engine, surface and device.
Why do Adobe and the Marketing Science study reach opposite conclusions?
Different windows and different denominators. Adobe’s retail series runs to July 2026, after the conversion gap inverted in AI’s favour; Kaiser and Schulze’s twelve months end in July 2025, when AI referrals were still converting below most channels. Adobe measures session-level conversion on tagged traffic; the academic study measures transactional outcomes per referred session across a year. Both are right about their own data.
Is 70.6% of AI traffic really hiding in Direct?
The number is real and narrower than the claim. It comes from one vendor’s detection model: 14,413 of 20,428 recognised AI visits arrived with no referrer. Two other vendors measuring the neighbouring question report 34% and 35.7%. None of them is measuring your site.
What should a small site getting 500 AI visits a month do?
Nothing that needs statistical significance. Instrument referrers, add the checkout question, build a forty-question panel. Then work on the pages that get cited rather than the pages you wish were cited. At that volume the compounding asset is content structured for extraction, not a media budget.
How many prompts belong in a tracking panel?
Enough to cover the buying questions in one category, few enough to run weekly without lying about it. Forty to a hundred is the working range. What matters more than the count: the set stays fixed for a quarter, every prompt runs multiple times, and the number of runs is reported next to every percentage.