Google Is Monetising Fewer Clicks. Meta Is Charging You More. Here’s Your Q1 Budget.
The Ad Machine Slowed Down Just as the AI Bill Came Due
What Alphabet, Meta, Amazon and Reddit just told you about next quarter’s budget
For two decades, the most valuable piece of real estate in advertising was a white page with ten blue links on it. That page has not gone anywhere. It has just stopped being where the money gets made.
That is the short version of the September quarter. The long version is a supply-and-demand story that most earnings coverage got backwards. Everyone fixated on the capital expenditure line — the trillion-dollar buildout, the negative cash flow, the commitments stacking up behind it. Fair enough. But if you are holding a Q1 budget, the interesting question is not how many chips Google bought. It is what the shape of these four results tells you about the price of attention in January.
The triangle: two lines went one way, one went the other
Three numbers describe Alphabet’s quarter, and they do not get along.
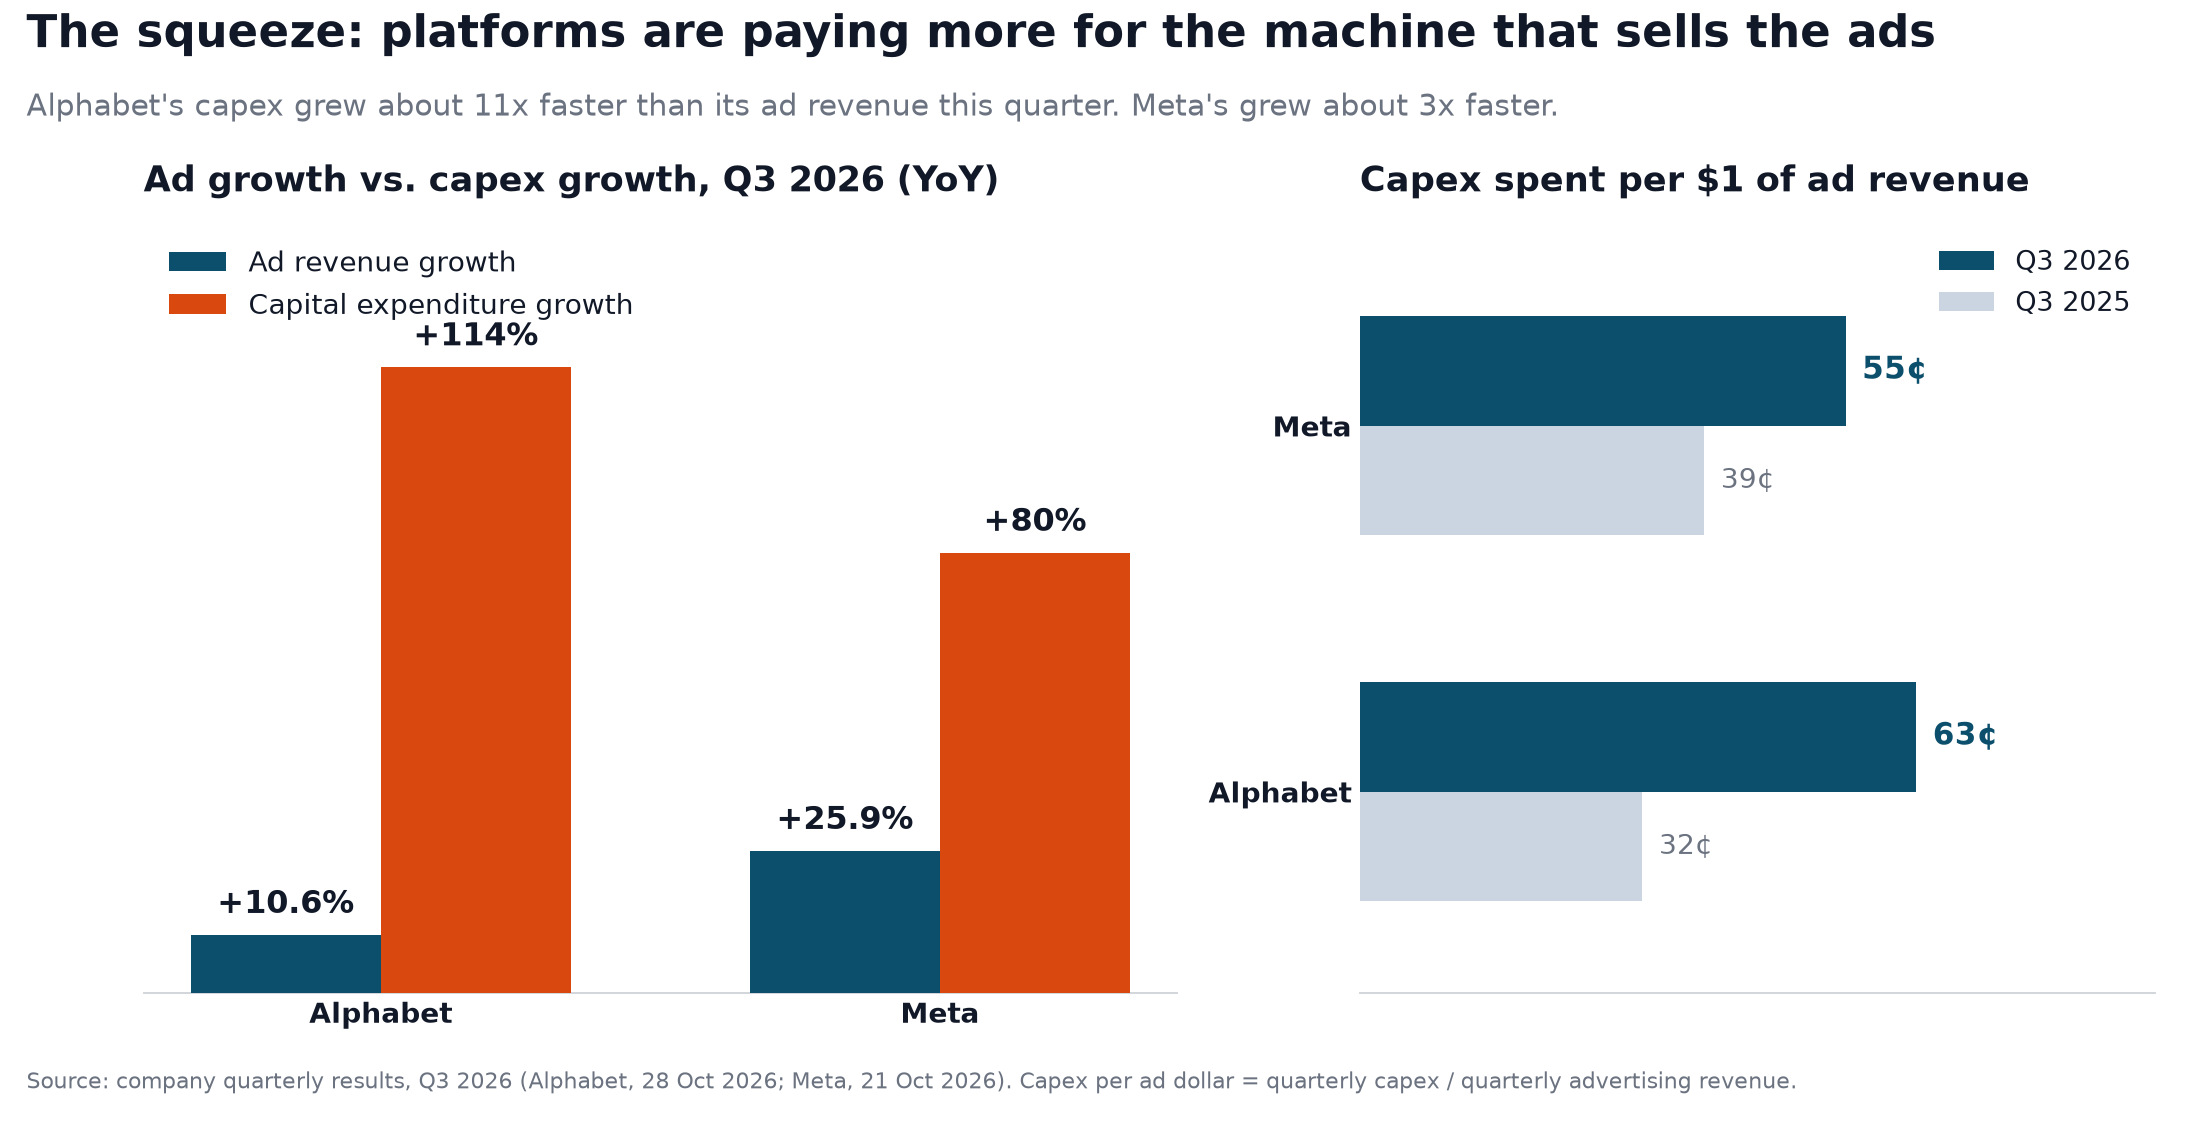
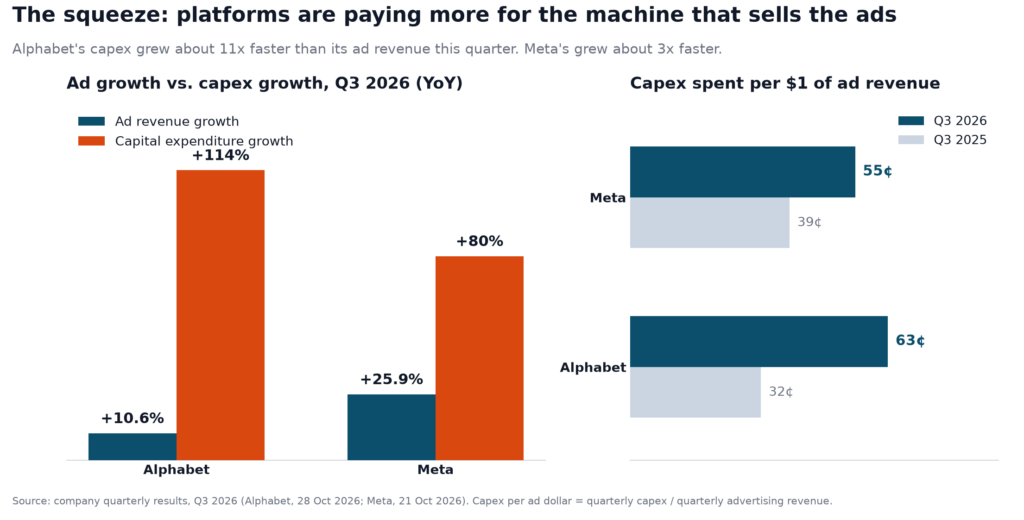
Advertising revenue came in at $82.01 billion, up 10.6% year on year. Capital expenditure was $51.4 billion, up 114%. Free cash flow was negative $9.1 billion — only its second negative quarter since going public in 2004.
Capex grew roughly eleven times faster than advertising. That is the whole tension in one ratio, and it is not a Google-only problem.
Meta spent $34.91 billion on capex against $19.37 billion a year earlier, an 80% jump, while its ad revenue grew 25.9%. Capex grew about three times faster than the business it is supposed to feed.
Alphabet: the queries are fine, the arithmetic is not
Alphabet’s problem is not that people stopped searching. Search queries grew faster than at any point in five years, according to Sundar Pichai. The problem is what happens after the query.
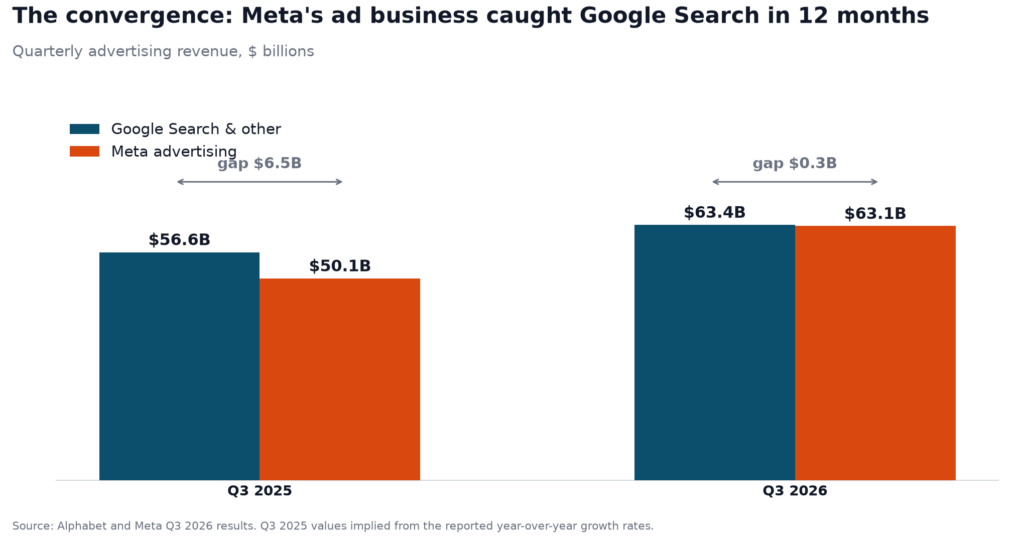
Search and other revenue reached $63.35 billion, up 12%. Sounds healthy until you put it in sequence: that line grew 19% in the first quarter and 17% in the second. Total advertising, at $82.01 billion, decelerated to 10.6% from 14.4% the quarter before. That is the weakest pace in five quarters.
Why? Because Google is now answering more questions itself. AI Overviews and AI Mode summarise rather than hand over a list of links, and summarised answers generate fewer clicks and fewer ad slots per query. Philipp Schindler, Google’s chief business officer, acknowledged on the call that AI-driven queries monetise at a lower rate than the classic results page — a polite way of saying the new product is cannibalising the old one.
The market did the arithmetic for Alphabet. The stock fell by 12% to 13% in a single session, its worst day as a public company, shedding close to half a trillion dollars of market value. Meanwhile Google Cloud more than doubled to $30.7 billion, and the company held its 2026 capex guidance at $195–205 billion while flagging a significant increase in 2027.
So: the crown jewel decelerates, the moonshot doubles, and the bill arrives before the revenue does. If you have ever run a P&L, you know exactly how that meeting goes.
Meta: the quarter everyone misread as a win
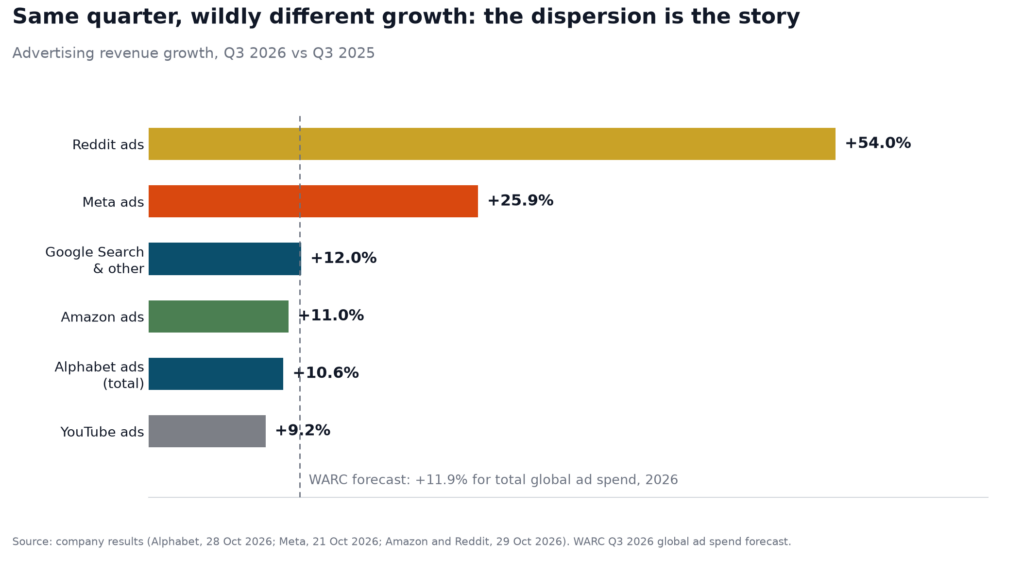
Meta’s ad revenue was $63.06 billion, up 25.9% — more than twice Google Search’s growth, the widest growth gap between the two since 2021. Headlines called it a blowout. Look one line lower.
Operating income fell to $12.99 billion from $18.78 billion, and the operating margin collapsed from 41% in Q1 to 31% in Q2 to 20% now. A $9.9 billion legal charge did much of that damage, so the underlying business is not broken. But free cash flow still came in around negative $2 billion once you subtract capex from operating cash, and 2026 capex is guided to $135–145 billion including finance lease principal.
What matters for you is how Meta grew. Average price per ad rose 14%. Impressions grew in the high single digits. Revenue growth of 25.9% against that volume growth means more than half of the quarter’s expansion was pricing.
Then there is the geography, which nobody talks about and everybody should. Asia-Pacific impressions grew 14% while average price per ad there rose 1%. In the US and Canada the pattern inverts: that region still throws off $28.44 billion of the $63.06 billion, and it is where the pricing power lives. Cheap volume in APAC, expensive volume at home. If your CPM report looks calm and your finance team disagrees, check which region each of you is looking at.
Amazon: the quiet argument for discipline
Amazon’s advertising services brought in $19.64 billion, up 11% — or 12% in constant currency, against 22% a year ago. Growth halved, and Amazon blamed the calendar: Prime Day moved into Q2 for most large markets, so the year-on-year comparison is distorted. It guided Q4 ad growth into the high teens.
Now the interesting part. Advertising is now close to 10% of Amazon’s $201.9 billion in net sales, and operating income jumped to $28.1 billion from $17.4 billion. Amazon is growing its ad business while its overall profitability improves, which is the opposite of what happens when a platform has to raise prices to cover a buildout.
It also shipped Amazon Ads Agent and Full-Funnel Campaigns, which plan, buy and optimise across sponsored, display, video and streaming in one go. That is the real competitive move: not more inventory, but less labour required to buy it. If your team’s hours are the constraint in Q4, an agentic buying console is worth more to you than another placement.
Reddit: the canary in the referral pipe
Reddit is the cleanest evidence that the gate moved. Ad revenue rose 54% to $847 million; total revenue rose 53% to $895 million; net income jumped 74% to $283 million on a 45% adjusted EBITDA margin. Click volume grew more than 50%, and conversions more than tripled.
And yet the stock fell about 17%, because Reddit told investors something uncomfortable: search referrals dropped by more than a million visits a week in October, and daily active users could fall by a low double-digit percentage in Q4. Management is now testing a logged-in-only experience outside the US, on the logic that logged-in and app users account for over 80% of monetisation.
Read that again. A platform with 54% ad growth is voluntarily closing its front door to the open web, because the open web no longer delivers. If Reddit needs a wall, so does every publisher that used to live on search referrals. And when the walls go up, the inventory you can buy programmatically gets scarcer and more expensive — which is exactly where the next twelve months are pointing.
The one table to screenshot
Here is the quarter compressed into something you can paste into a planning deck.
| Alphabet | Meta | Amazon | ||
|---|---|---|---|---|
| Ad revenue, Q3 2026 | $82.01B | $63.06B | $19.64B | $847M |
| YoY growth | +10.6% | +25.9% | +11% | +54% |
| Direction of travel | Slowing: total ads +14.4% in Q2; Search +19% → +17% → +12% | About twice Google Search’s growth; widest gap since 2021 | Slowing: +22% a year ago; Q2 $19.81B → Q3 $19.64B | Fastest of the four; Q4 user risk flagged |
| Quarterly capex | $51.4B | $34.91B | Not ad-attributable (AWS-led) | Not disclosed at this scale |
| Capex YoY | +114% | +80% | — | — |
| Capex per $1 of ad revenue | 63¢ (was 32¢) | 55¢ (was 39¢) | — | — |
| Cash quality | FCF −$9.1B | FCF ≈ −2.1B\*∣Operatingincome28.1B, up from $17.4B | 45% adjusted EBITDA margin | |
| What it means for your budget | Volume is fine; yield is the problem | Demand is strong, and you pay for it in price | The cheapest incremental reach of the four | Small, dense, and getting more expensive |
*Derived: operating cash flow minus capex.
Two footnotes worth carrying into that meeting. First, capex per ad dollar is a rough ratio, not an accounting metric: Alphabet’s capex also funds Cloud, which doubled to $30.7 billion, so not all of that spend is a tax on Search. Second, Meta’s free cash flow figure is derived from operating cash flow minus capex, and the company’s own capex definition includes finance lease principal — read the filing before you quote it at a board meeting.
Growth now means price, not volume
Strip the noise and one mechanism explains three of the four results. Volume is decelerating; price is not.
Meta: price per ad +14%, impressions in the high single digits. Alphabet: queries at a five-year high, ad revenue growth at a five-quarter low. Reddit: click volume up more than 50% and conversions more than tripled, with pricing doing much of the remaining work.
When spend growth outruns impression growth, the residual is price. WARC now forecasts global ad spend at $1.34 trillion in 2026, up 11.9% — a forecast revised upward, not downward. If the market grows 11.9% while the supply of impressions grows in the single digits, the difference is not magic. It is your CPM.
This is the part marketers keep getting wrong. They hear “AI is improving ad efficiency” and assume efficiency means cheaper. It does not. Efficiency is what platforms sell to justify a higher price for the same impression. The savings show up in the vendor’s gross margin, not your invoice.
The AI Mode problem Google will not call a problem
Google is expanding ads inside AI Mode to ten markets — Australia, Canada, India, Kenya, Malaysia, New Zealand, Nigeria, Pakistan, the Philippines and Singapore — with Brazil, Mexico and the UK queued for Q4. In the US it is testing multi-turn ads that appear during follow-up questions.
Think of this as a supply curve. Google cannot raise yield per AI query yet, so it opens more ad slots in more places and hopes volume plus learning closes the gap. Early signals are decent: click-through rates on sponsored product listings inside AI Mode are reportedly comparable to organic listings, and AI Mode queries run about three times longer than classic searches.
But do not benchmark AI Mode against the search box you know. New inventory always prices low and climbs. The question is not whether AI Mode ads are cheap today. It is whether cost per acquisition holds when the format normalises and everyone bids on it. Buy early, measure properly, and keep the two formats on separate scorecards — the moment you blend them, you will lose the signal about which one is actually working.
The number nobody is quoting
Here is a ratio you will not find on an earnings slide, and it is the cleanest way to see the squeeze: capital expenditure per dollar of advertising revenue.
Alphabet: 63 cents this quarter, against 32 cents a year ago. Meta: 55 cents, against 39 cents.
Roughly double at both companies. Annualise it and Alphabet is spending the equivalent of about 62% of its ad revenue on infrastructure it will depreciate over years, betting that AI-driven formats eventually earn more per impression than the ones they replaced.
That bet may well pay off. Cloud is the hedge, and it is working. But note what it does to incentives in the meantime. A company that must service a $200 billion annual capex line has three levers: more inventory, higher prices, or better conversion for advertisers. Two of those three are your problem.
What this does to Q4 CPMs and inventory
Expect four things between now and February.
Tighter premium inventory. Reddit’s wall, AI answers replacing link lists, and logged-in requirements all shrink the pool of cheap programmatic impressions.
Wider price dispersion by geography and format. Meta’s APAC numbers already show the pattern: abundant cheap inventory in one region, pricing power in another. Your blended CPM will hide both.
Format churn as a pricing strategy. Every new ad surface — AI Mode, multi-turn placements, full-funnel buying — launches at a discount and reprices once adoption is proven. Budget for two learning cycles, not one.
Better measurement as the sales pitch. Google says Gemini helped advertisers generate over 1.5 billion campaign assets in the quarter, seven times a year ago; Meta says nearly 10 million advertisers used at least one of its AI tools, and that adopters saw roughly 5% more conversions and spent 9% more. Read the second half of that sentence again: the tools are also an upsell mechanism.
Three budget moves for the next quarter
1. Rebuild your search forecast on price, not volume. Most plans assume flat CPCs plus volume growth. Reverse it. Model CPC or CPM inflation of 8–12% against flat query volume, then stress-test what happens to your CPA if AI surfaces take another five points of click share. If the plan only works when prices are flat, the plan is already broken.
2. Create a line item for AI surfaces and keep it small. Ten markets today, more in Q1. Take 3–5% of search budget, ring-fence it, and judge it on incremental conversions against a holdout — not on CTR, which is flattered by the format. If it cannot beat the control, you have learned something cheap.
3. Tilt the marginal dollar toward provable incrementality. Amazon grew ad revenue 11% while growing operating income 61%; it does not need to squeeze you to fund a buildout. Meta’s growth is real, but you are paying for it in price, so demand clean lift tests before you scale. Google is still the highest-intent inventory on the internet and you should not walk away from it — but the burden of proof has moved to its new surfaces, not its old ones.
And one organisational move that costs nothing: put a single owner on cross-platform price inflation. Right now, search, social and retail media each defend their own CPMs, and nobody owns the blended number your CFO actually sees.
The caveat: one quarter is a signal, not a trend
Be careful with all of this. Three of the numbers above are distorted by one-offs: Alphabet made a $5.2 billion cash payment tied to a 2018 European regulatory fine and booked investment losses; Meta absorbed a $9.9 billion legal charge; Amazon’s ad comparison was broken by Prime Day moving into Q2. Strip those out and the picture softens.
Two things survive the adjustment. Search growth decelerating 19% → 17% → 12% across three quarters is a trend, not a blip. And negative free cash flow at two of the largest ad businesses on earth is a structural change in how these companies are financed, not a timing quirk.
One more methodological warning. Growth rates in this story are year on year, because that is how the filings report them. Plenty of coverage mixes in quarter-on-quarter figures or currency-adjusted numbers without saying so. When a number looks wrong, check the denominator before you check the platform.
Bottom line
The ad machine did not break this quarter. It slowed, while the bill for the AI that is supposed to replace it came due. Alphabet is monetising fewer clicks at a higher infrastructure cost and telling you so. Meta is monetising the same attention at a higher price and calling it AI. Amazon is monetising purchase intent while getting more efficient. Reddit is monetising a smaller, denser audience and building a wall around it.
Your budget should follow the platform that can prove AI is lifting your returns — not the one with the most impressive capex line. That has always been true. This quarter it just became measurable.
Next time someone shows you a data-centre rendering and calls it a growth strategy, ask one question: what did it do to your cost per acquisition?
Frequently asked questions
Did Google’s advertising business actually shrink in Q3 2026?
No. Alphabet’s ad revenue rose 10.6% to $82.01 billion. What shrank was the growth rate — from 14.4% in Q2 to 10.6% — and free cash flow, which fell to negative $9.1 billion as capex hit $51.4 billion. Deceleration, not decline, and the distinction changes how you plan.
Why is Meta growing ad revenue so much faster than Google?
Partly product, partly surface. Meta’s AI tools sit inside a feed where intent is discovered, and it can add inventory without replacing the thing that earns. Google is replacing link lists with AI answers, and summarised answers create fewer ad opportunities per query. The gap — 25.9% versus 12% for Search — was the widest since 2021.
Does negative free cash flow mean these platforms are in trouble?
Not in the way the phrase suggests. It means capex has outrun operating cash, which is what happens when you front-load a decade of infrastructure. Microsoft spent $45.2 billion on capex in the same period and still produced $18.6 billion of free cash flow, and its stock barely moved. The market is not punishing spending; it is punishing spending without demonstrated monetisation.
Should I move budget off Google Search right now?
No. Search remains roughly $63 billion a quarter of the highest-intent inventory available, and pulling out hands share to competitors at the exact moment prices reset. Rebalance instead: keep Search as your intent layer, ring-fence a small test budget for AI surfaces, and hold a reserve for Q1 when new formats get repriced.
What single metric should I watch next quarter?
Price versus volume, on every platform, every quarter. If ad revenue keeps growing while impressions stay flat, you are paying for growth rather than buying it. The moment that ratio flips — volume growing faster than price — the squeeze has ended and budgets can expand again.