You Need Less Than You Think to See What Matters
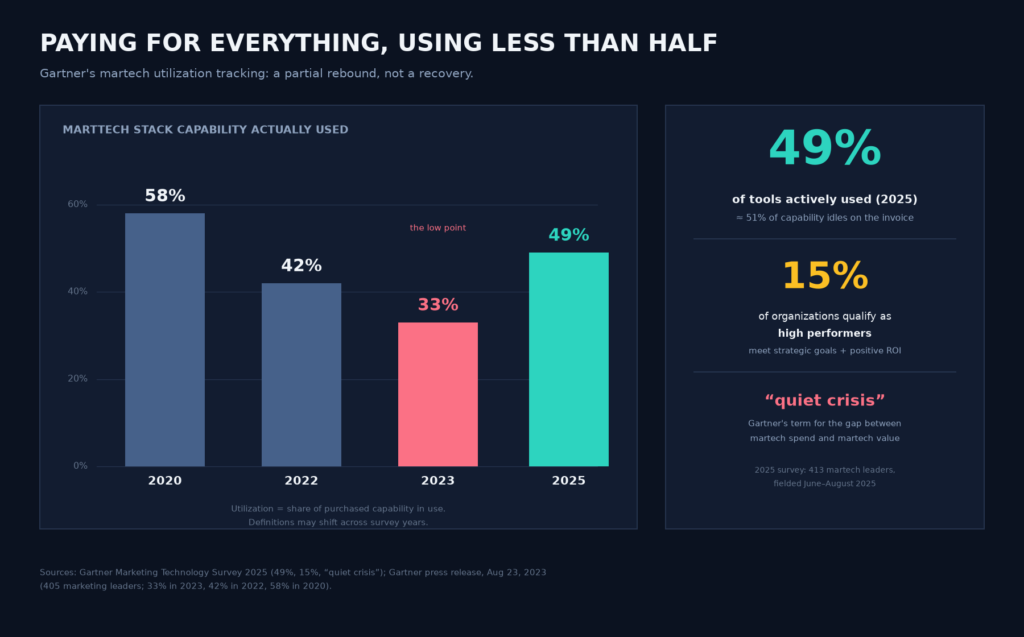
The martech market just did something it hasn’t done since 2011: it stopped growing. The 2026 Marketing Technology Landscape from chiefmartec counts 15,505 products — up just 0.79% year over year, a rounding error. Meanwhile, Gartner’s 2025 Marketing Technology Survey finds teams actively using only 49% of what they pay for, and just 15% of organizations qualifying as high performers: strategic goals met, ROI positive. The industry calls the gap between those two numbers a quiet crisis.
The countermove isn’t another purchase. It’s a minimal viable analytics stack (MVAS): the smallest set of tools that can answer your team’s named decisions, assembled by function instead of feature. What follows is a ranked, honest build — three deliberate layers, tier-by-tier verdicts, and a four-step assembly path — not another top-50 tools list. The rule underneath all of it: every tool either answers a named decision, or it’s shelfware with a renewal date.
1. Peak Martech: The Market Stopped Growing Before Your Budget Did
Scott Brinker and Frans Riemersma have counted martech products every year since 2011, when the landscape held 150 tools. Fifteen years later it holds 15,505 — more than 100× growth — and the 2026 edition grew by just 121 products net. That’s the first flat year in the exercise’s history, and the researchers titled their report accordingly: Peak Martech Achieved! (Maybe).
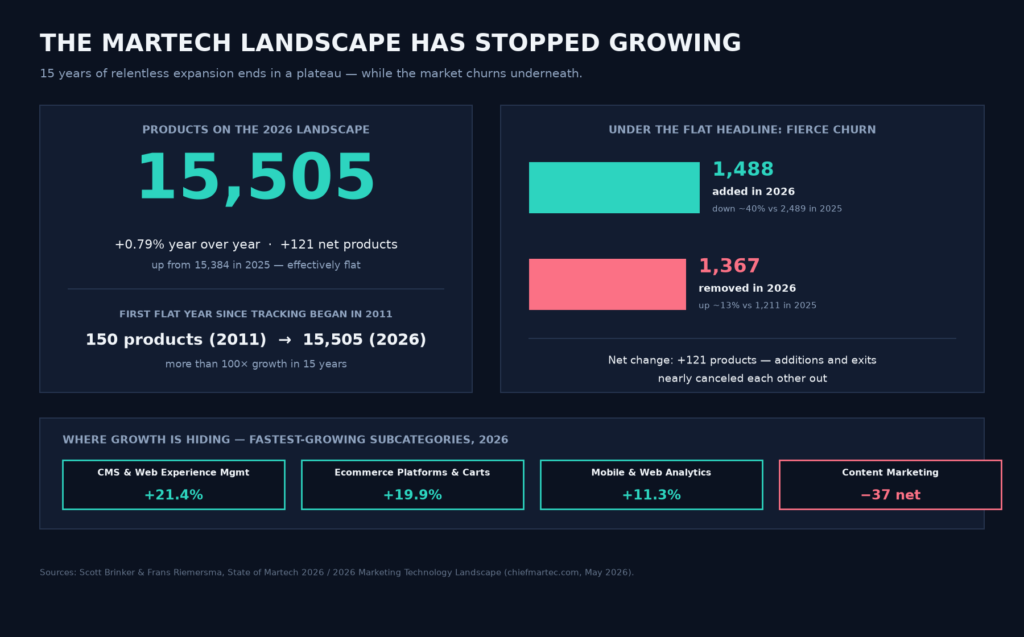
Flat headlines hide violent churn. The 2026 landscape added 1,488 products — about 40% fewer than the 2,489 added in 2025 — and removed 1,367, up roughly 13%. Nearly one in ten products changed status in twelve months. Growth migrated, too: CMS and web experience management rose 21.4%, ecommerce platforms 19.9%, mobile and web analytics 11.3%, integration and data tooling 8.0%. Content marketing, after years of AI-fueled expansion, shrank by 37 products net.
Why should you care? Because a churning, plateaued category punishes collectors and rewards builders. When 1,367 products can vanish from the map in a year, any stack assembled by brand momentum is a liability. A stack assembled around your own decisions survives the churn — the vendors change; the questions don’t.
2. The Quiet Crisis: Paying for Everything, Using Half
Gartner’s utilization numbers tell the same story from the buyer’s side. In an August 2023 survey of 405 marketing leaders, capability in use had fallen to 33% — down from 42% in 2022 and 58% in 2020. The 2025 Marketing Technology Survey shows a rebound to 49%, but Gartner’s own framing is blunt: only 49% of tools are actively used, only 15% of organizations meet strategic goals with positive ROI, and the stack is in a quiet crisis. (Survey definitions may shift across years, so treat the trendline as directional rather than precise.)
The failure mode isn’t mysterious. In chiefmartec’s 2025 survey of 96 martech and marketing operations leaders, only 6.2% said they have all the skills needed to get full value from their stack; 62.5% rated their data quality and availability fair or poor; and fewer than half (42.7%) said AI-driven apps integrate well with what they already own. Tools arrive faster than the skills, data, and plumbing required to use them. The invoice grows; the capability doesn’t.
Which is why the answer to 49% utilization is almost never a fiftieth tool. It’s a smaller stack that someone can actually operate — and a ranking principle for deciding what stays.
3. The Ranking Principle: Function Over Feature
Here’s the uncomfortable truth about most tool evaluations: they rank features. The MVAS ranks decisions. Before any demo, write down the questions your team must answer this quarter — which channels deserve the next dollar, which segments are churning, what a lead is worth, when to kill a campaign. A tool earns its place only if it answers one of those named questions and exchanges data cleanly with the rest of the stack.
That second condition matters more than vendors admit. In MarTech’s 2025 State of Your Stack survey of 169 marketing respondents (52.7% practitioners, 23.1% managers, 15.4% directors), data silos were the single biggest fear about the stack’s future, cited by 20.7% of respondents — ahead of cost of ownership at 17.2% and the skills gap at 16.6%. Respondents named integration capability a top purchasing criterion in roughly twice as many cases as ease of use. A stack is judged by its coupling, not its parts.
So minimal doesn’t mean cheap. It means complete for decisions: everything present answers a question, everything absent would be decoration. A $200-a-month tool that answers a named decision outranks a $20,000 suite that answers none — and a beautiful dashboard that nobody acts on ranks below a plain spreadsheet that somebody does.
4. The Build at a Glance: Three Layers, One Deliberate Choice Each
Strip away the vendor logos and every marketing analytics stack is really three functions: capture and unify the truth, turn it into decisions, turn decisions into moves. The MVAS makes one deliberate choice per layer — and refuses to add a second until the first is earning its keep.
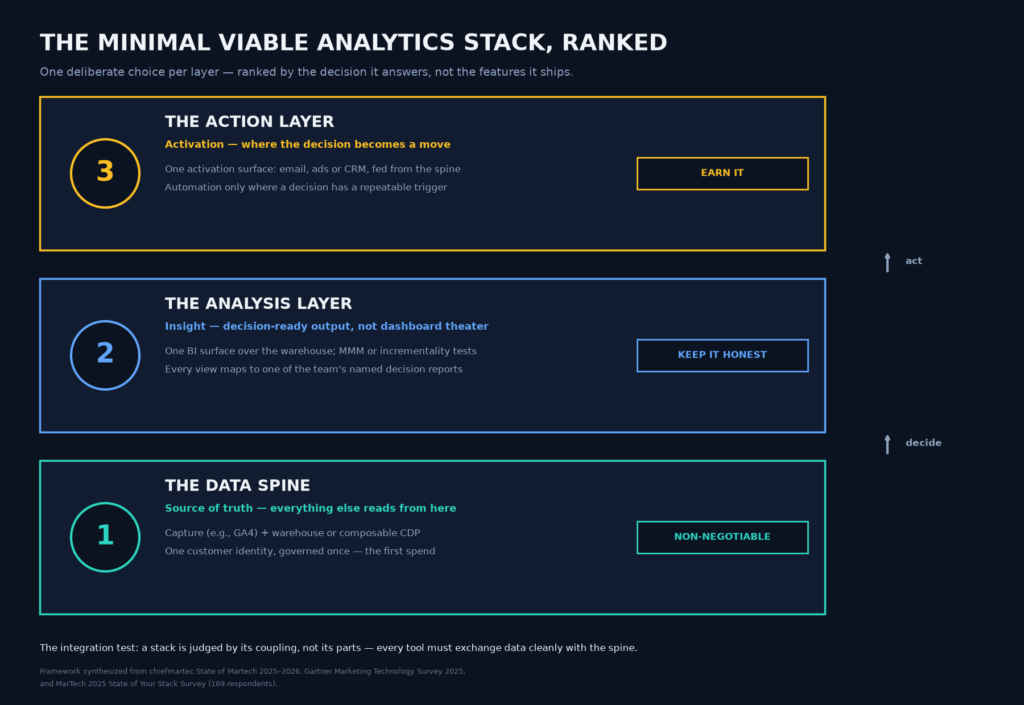
The order is the strategy. Most teams buy backwards — activation first (another email platform, another ad channel), dashboards second, truth never — and then wonder why every report disagrees with every other report. Build bottom-up, and each layer has something solid to stand on.
5. Layer 1, Ranked First: The Data Spine
The spine is capture plus a single customer truth: product and web analytics (GA4 or an equivalent) feeding a warehouse or a composable CDP that resolves one identity per customer. Everything else in the stack reads from here. When two tools disagree — and they will — the spine is the tiebreaker, or you don’t have a stack, you have a pile.
The market is voting this way already. In chiefmartec’s 2025 survey, 56.2% of respondents had integrated their stack with a cloud data warehouse or lakehouse, and 59.4% of those were running AI applications on top of it. The same survey found warehouse-integrated teams reported far better AI integration than the rest — 62.9% versus 26.7% saying AI apps fit their stack well. Frans Riemersma’s line from the State of Your Stack report deserves framing: if AI weren’t sucking all the oxygen out of the room, the cloud data warehouse would be the trend everyone talks about.
One honest caveat: a warehouse isn’t magic. It’s plumbing, and plumbing needs an owner. If nobody governs identity, freshness, and access, you’ve just moved your silos into a more expensive building. The spine is the non-negotiable first spend — spend it on governance as much as on storage.
6. Layer 2, Ranked Second: The Analysis Layer
This layer converts the spine into decisions: one BI surface over the warehouse, plus a measurement approach you can defend — marketing mix modeling for budget allocation, incrementality tests for causality, or both. The ranking criterion is brutal simplicity: does the output change what someone does on Monday? If a report exists only to be screenshotted into a QBR deck, it’s theater, not analysis.
Keep the surface count at one. Every additional dashboard tool is another place for numbers to diverge, another login nobody remembers, another renewal that auto-renews. The five decision reports your team actually needs — budget reallocation, channel efficiency, funnel leakage, retention risk, experiment readouts — can live on one honest surface. Depth of decision beats polish of dashboard, every time.
And measurement deserves its honesty check. Attribution models are opinions with math attached; MMM needs history and variation; incrementality tests need the discipline to hold out a control group. None of that is a reason to skip measurement — it’s a reason to pick one method, state its assumptions, and let it answer the named question instead of buying three tools that each answer a different one.
7. Layer 3, Ranked Third: The Action Layer, Earned
Activation is where a decision becomes a move: the email platform, the ads manager, the CRM — plus automation that fires when a named decision has a repeatable trigger. The keyword is earned. You add automation after the pattern exists (churn risk above threshold → win-back sequence; cost per acquisition above ceiling → budget pause), not before. Automating a decision nobody has made is how teams scale their mistakes.
This is also where the ground is shifting fastest. In the Vibe Code Check survey — 302 marketing leaders at software companies who already use tools like Claude Code, Cursor, Copilot, or Lovable — 46% had already replaced a purchased SaaS tool with something they built themselves. The top use cases were marketing workflow automations (57%), custom integrations between platforms and databases (50%), and data cleaning, transformation, or analysis (48%). Agentic pipelines are becoming the action layer’s new glue.
But note the pattern in those numbers: the winners are custom integrations and automations on top of a data layer — not hand-rolled empires. Build the trigger, buy the surface, and keep the spine governed. That’s the difference between an action layer and a maintenance backlog.
8. Tier-by-Tier Verdicts: What Earns Its Place, What Gets Cut
Tier 1 — keep, irreplaceable. The warehouse or composable CDP, and one honest BI layer over it. These are the source of truth and the decision surface. Cut them and nothing else in the stack can be trusted, which is exactly how teams end up arguing about whose number is right instead of deciding what to do.
Tier 2 — conditional, prove it. Advanced attribution suites, experimentation platforms, AI copilots. Valuable only after Tier 1 exists, and only if they integrate with it cleanly. The warning label is fresh: in Gartner’s June–August 2025 survey of 413 martech leaders, 45% said vendor-offered AI agents fell short of promised business performance, while 81% were already piloting or implementing agents. Pilot against a named decision, measure the delta, and let the result — not the demo — decide the renewal.
Tier 3 — cut, without ceremony. Redundant point tools, standalone dashboards that duplicate the BI surface, and AI analytics wrappers whose capability already ships in the suites you own. This tier is where the unused 51% lives. The uncomfortable reframe: most teams don’t need more stack — they need to use the Tier 1 they already pay for.
9. The Build Path: Four Steps to an MVAS
Step 1 — Catalog what you own. Map every current tool to the question it answers. No question? It’s a candidate for the cut list. The audit usually reveals the minimal stack is already hiding inside the bloated one — you’re paying for it twice, once in licenses and once in attention.
Step 2 — Build the spine first. No analysis tool matters until one clean customer truth exists. This is the non-negotiable first spend, and it includes the boring parts: identity resolution, access rules, someone whose job description says owner.
Step 3 — Add analysis for decisions, not views. Pick the one BI surface that serves your named decision reports. Forty widgets is not a strategy; five answers are.
Step 4 — Activate only where a decision triggers an action. Add automation when a named decision has a repeatable trigger — then, and only then. The action layer is earned, never assumed.
Run the steps in order. Teams that skip to step 4 end up automating chaos; teams that skip step 2 end up with beautiful, contradictory dashboards. The sequence is the whole trick.
10. Risks and Honest Caveats
Minimal is not zero. A stack without a spine and one honest analysis layer can’t answer anything — the floor is real, and pretending otherwise is just underfunding with better branding.
The build-vs-buy temptation cuts both ways. Agentic AI makes custom pipelines cheap, which tempts teams to hand-roll everything — but bespoke analysis without a governed spine is technical debt with a friendly interface. The 46% who replaced SaaS tools in the Vibe Code Check survey were mostly replacing workflow glue, not rebuilding their warehouse.
Integration surprises are the hidden tax. A minimal stack that won’t talk to the suite you already own costs more than the bloated one, because glue code is written by someone, maintained by someone, and breaks while someone is on vacation. Price the coupling before you price the license.
And treat tool names as perishable. The landscape removed 1,367 products in a single year; any specific recommendation in any article — including this one — is a drafting-time snapshot. The ranking principle is durable. The logos are not.
Conclusion: The Smallest Stack That Decides Beats the Largest That Displays
You don’t need more analytics tools. You need the right three layers, used properly: a data spine that tells one truth, an analysis layer that serves named decisions, and an action layer earned by repeatable triggers. In a category that plateaued at 15,505 products while teams use 49% of what they buy, the winning move isn’t to shop — it’s to audit, build the spine, and let everything that doesn’t answer a named decision go. The smallest stack that decides beats the largest stack that only displays. Start with the audit this week; the renewal calendar makes the decision for you if you don’t.