You Don’t Need 40 Reports. You Need These 5.
Picture the Monday meeting. Forty dashboards open in forty browser tabs. Someone screenshares the attribution view, someone else argues that the numbers look different in the CRM, and after fifty minutes the room agrees to “keep monitoring it.” Nobody cuts a channel. Nobody moves a dollar. The meeting ends, and the reports go back to sleep until next Monday.
Sound familiar? Here is the uncomfortable part: this is not a data problem. It is a decision problem wearing a data costume.
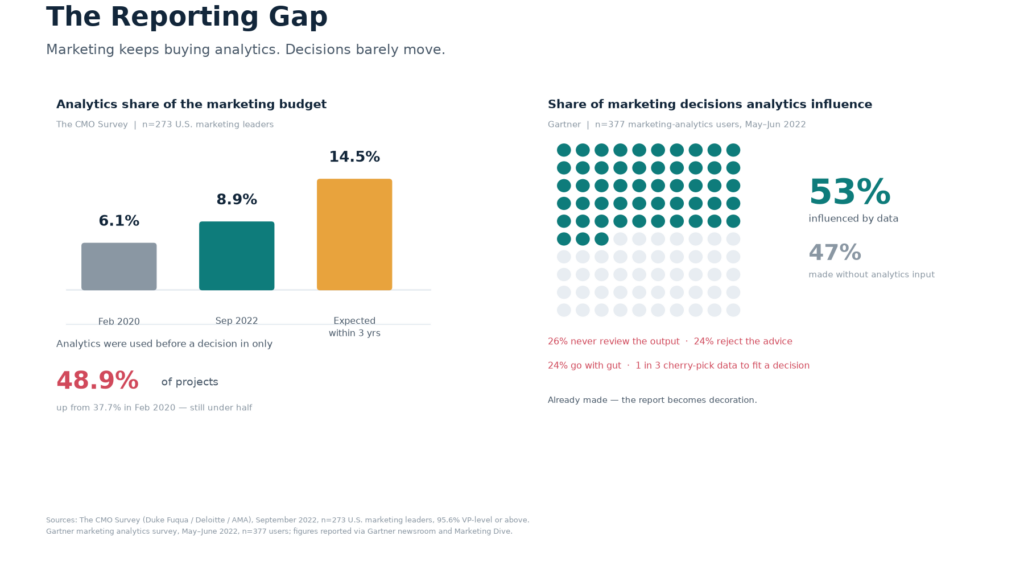
The numbers back this up. In a May–June 2022 survey of 377 marketing-analytics users, Gartner found that analytics influenced only 53% of marketing decisions. Roughly a quarter of respondents said decision makers never even review the analytics team’s output (26%), reject its recommendations (24%), or simply go with their gut (24%). A third said decision makers cherry-pick data to support a choice they have already made. The report is not the bottleneck. The decision is.
And we keep spending anyway. The September 2022 CMO Survey — run by Duke’s Fuqua School with Deloitte and the American Marketing Association, polling 273 U.S. marketing leaders, 95.6% of them VP-level or above — found analytics claiming 8.9% of the marketing budget, up from 6.1% in early 2020, with CMOs expecting to reach 14.5% within three years. Yet analytics were used before a decision in only 48.9% of projects. We are buying more instrument panel and driving barely half the car.
Why more reports make it worse
The instinct, when a report feels useless, is to add another report. A new dashboard. A new tab. That instinct is exactly backwards, and the psychology explains why.
In the famous 2000 jam study, Iyengar and Lepper set up a tasting table with either 24 flavors or 6. The big display drew a crowd — 60% of passing shoppers stopped, versus 40% for the small one. Then almost nobody bought: just 3% of the people who stopped at the 24-jam table made a purchase, against 30% at the 6-jam table. More choice pulled attention and then froze it.
A dashboard with forty metrics is the 24-jam table. It draws a crowd every Monday and sells nothing.
One honest caveat, because this matters: choice overload is not a settled law. A 2010 meta-analysis by Scheibehenne and colleagues found the average effect across dozens of studies was close to zero — the paralysis shows up under specific conditions, not everywhere. So do not read the jam study as proof that “fewer is always better.” Read it as a warning about what happens when options arrive faster than anyone can choose. That is precisely the condition most reporting stacks are in.
The cost of all that unmade choosing is enormous. McKinsey’s 2019 global survey of more than 1,200 executives found respondents spend an average of 37% of their time making decisions, and more than half of that time is used ineffectively. Only 37% said their organizations make decisions that are both high-quality and fast. For an average Fortune 500 company, McKinsey estimated the waste at more than 530,000 days of manager time a year — roughly $250 million in labor cost. The bottleneck was never the supply of information. It was the number of people willing to turn it into a choice and put their name on it.
The decision-first principle
So flip the order. Do not start with the data and ask what it might tell you. Start with the decision and ask what it needs to know.
A report earns its place only if a named person takes a named action when the number moves. If nobody does anything when the metric changes, it is not analysis — it is entertainment. That single test retires most dashboards on the spot.
This is the reporting layer of the metric-industrial complex problem we have traced before: organizations produce metrics because metrics are easy to produce, then mistake production for progress. The fix is not better data. Gartner’s own analysts put it bluntly — better data alone will not increase analytics’ decision influence; the real barriers are cognitive bias and the absence of a data-informed culture. You cannot buy your way out of a deciding problem.
There is also a ceiling worth knowing. Gartner found that organizations where analytics influenced fewer than 50% of decisions were more likely to say they could not prove marketing’s value — but once you cross that 50% threshold, pushing for ever more decision coverage brings diminishing returns. The goal is not to data-ify every choice. It is to make the handful of choices that matter actually data-informed.
The five reports that earn their place
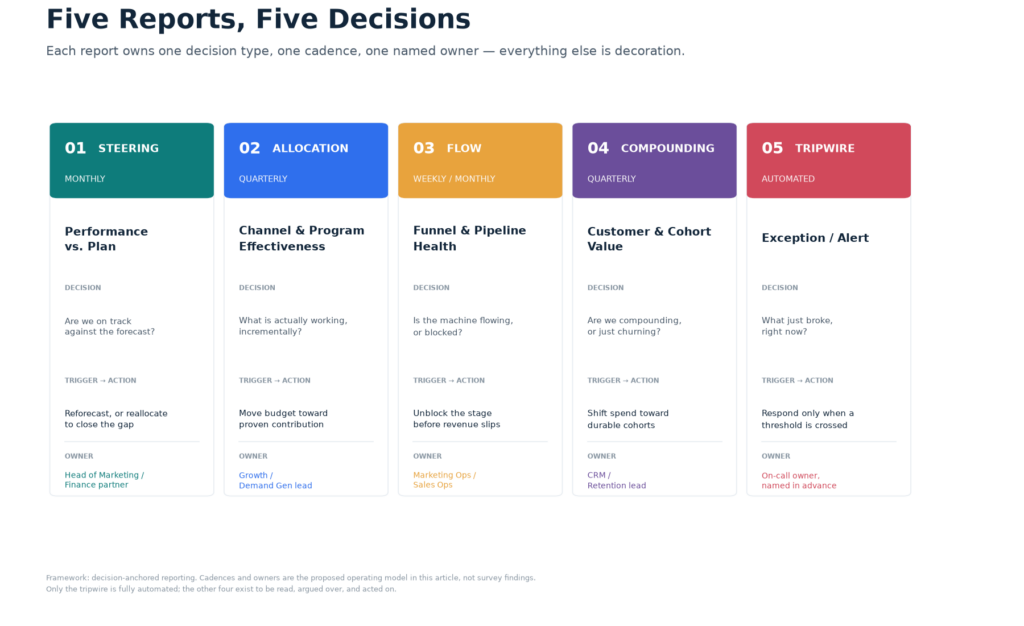
Here is the framework. Five reports, each owning one decision type, one cadence, and one named owner. Everything else is either a feeder into one of these five, or decoration.
Report 1 — Performance vs. Plan (the steering report)
The question: are we on track against the forecast, and what do we do about it? Monthly. This is the report that ties spend to the plan and surfaces the variance that matters — not a wall of numbers, but the gap between where you said you would be and where you are. The owner is the head of marketing with a finance partner, and the trigger is a variance threshold that forces a reforecast or a reallocation. Without that trigger, it is just a scorecard nobody acts on.
Report 2 — Channel & Program Effectiveness (the allocation report)
The question: what is actually working, incrementally? Quarterly. This report ranks channels and programs by contribution, not vanity — and it feeds real budget moves. The discipline here is incrementality: a channel that gets credit for conversions it would have won anyway is not performing, it is billing. The owner is the growth or demand-gen lead, and the action is moving money toward proven contribution. This is the report that should make someone uncomfortable, because it names winners and losers.
Report 3 — Funnel & Pipeline Health (the flow report)
The question: is the machine flowing, or is it blocked? Weekly or monthly. Conversion and velocity by stage, so you catch a blockage before it becomes a revenue miss next quarter. The owner is marketing ops or sales ops, and the trigger is a stage conversion or velocity dropping below its line. The point is early warning: a funnel problem is cheap to fix in week two and expensive to explain in month three.
Report 4 — Customer & Cohort Value (the compounding report)
The question: are we compounding, or just churning? Quarterly. CAC, LTV, retention and re-purchase by cohort — the long-term health check that tells you whether growth is durable or a treadmill. This is where the payoff of data-driven decision making actually shows up. In a study of 179 large publicly traded firms, Brynjolfsson, Hitt and Kim found that companies emphasizing data-driven decision making had output and productivity 5–6% higher than their other investments and IT use would predict, with parallel advantages in asset utilization, return on equity and market value. The edge is real — but it comes from deciding differently, not from collecting more.
Report 5 — The Exception / Alert Report (the tripwire)
The question: what just broke, right now? Automated. This is the one report that should be fully hands-off: it surfaces only what is anomalous, a metric outside its threshold, and otherwise stays silent. Its job is to disappear until something breaks. The owner is an on-call person named in advance, so an alert never lands in a group inbox where everyone assumes someone else will handle it.
Why these five cover the whole decision surface
Every marketing decision is one of five types: steering (are we on track?), allocating (where does the money go?), fixing flow (where is it stuck?), compounding (is it durable?), or reacting (what just broke?). The five reports each own exactly one. That is the whole logic — not a magic number, but a complete map of the decisions you actually make.
This also time-boxes attention. When each decision has a report and a cadence, you stop checking the wrong thing at the wrong frequency. A daily report for a monthly decision is noise; a monthly report for a daily failure is blindness. Cadence is not a scheduling detail — it is what makes the report useful at all.
And it forces the “so what” to be explicit. Each report is named for the decision it drives, not the data it contains. That reverses the usual failure mode, where teams report whatever the tool makes easy and then wonder why nobody acts.
How to build them: start from the decision, not the tool
Write the decision first. “Where do we cut or reallocate next quarter?” Then — and only then — design the report that answers it. Never lead with the dashboard’s default widgets; those are designed to show data, not to trigger choices.
Define the threshold and the action together. Every report needs a trigger line and a named owner who acts when it is crossed. A threshold without an owner is a suggestion; an owner without a threshold is a vibe. You need both, written down before the campaign runs, not after the data starts arriving. That pre-registration is also how you stop cherry-picking — Gartner found a third of decision makers do exactly that, and setting the metric before the result is the antidote.
Automate the tripwire only. The exception report is the one that should run itself, because its value is silence until something breaks. The other four exist to be read and argued over. Automating them defeats the purpose — you do not want a machine quietly “deciding” your budget reallocation while nobody debates it.
Then kill the rest. Audit the existing forty reports. Any that is not one of the five — or a feeder into one — gets retired, not archived. The kill-list is the discipline. A report you keep “just in case” is a report that will keep consuming attention forever.
The tripwire deserves special care
The exception report is the highest-leverage of the five and the easiest to get wrong, so it is worth slowing down here. The best evidence on what makes alerts work — or fail — comes from an unlikely place: hospital alarm research. It is the closest thing we have to a controlled study of what happens when humans are buried in notifications.
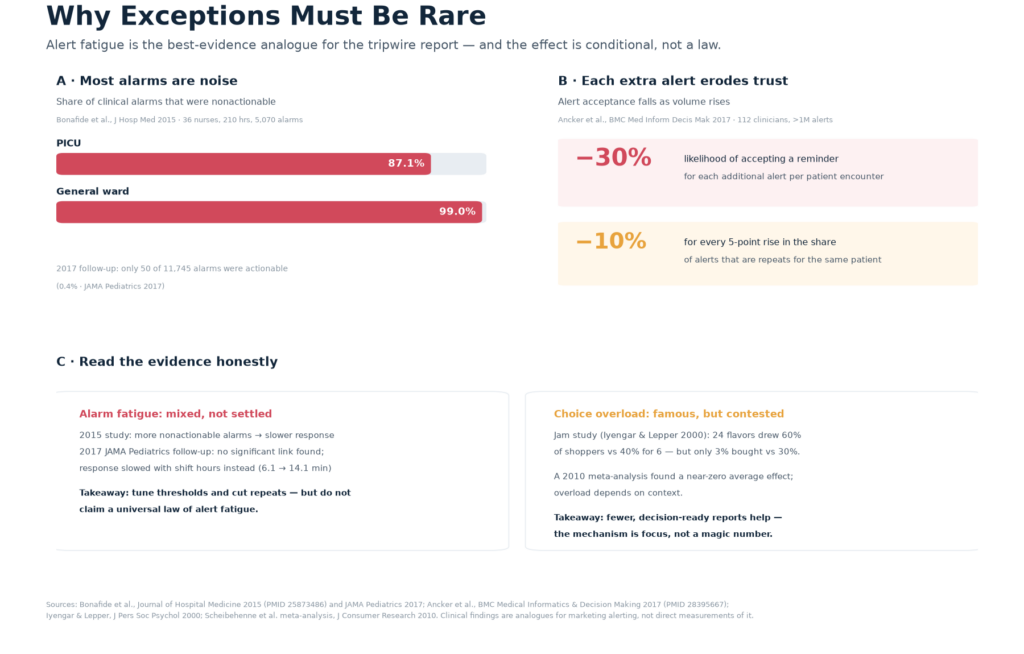
The noise problem is staggering. In a 2015 observational study of 36 nurses over 210 hours and 5,070 alarms, Bonafide and colleagues found that 87.1% of PICU alarms and 99.0% of general-ward alarms were nonactionable — they required no intervention at all. A 2017 follow-up in JAMA Pediatrics was even starker: of 11,745 alarms, only 50 were actionable. That is 0.4%. Imagine a marketing alert stream with that signal-to-noise ratio and ask yourself honestly whether yours is much better.
The trust problem is just as real. Ancker and colleagues, studying 112 primary-care clinicians and more than a million alerts in electronic health records, found that the likelihood of accepting a reminder dropped by 30% for each additional alert received per patient encounter, and by 10% for every five-percentage-point rise in the share of alerts that were repeats. Roughly a quarter of drug alerts and a third of reminders were same-patient repeats. The lesson for your tripwire is direct: every redundant alert you ship trains the team to ignore the next one — including the one that matters.
But here is the honest part, and it is important. The alarm-fatigue effect is not settled. The same Bonafide team’s 2017 JAMA Pediatrics study did not find a significant link between the number of nonactionable alarms and response time; instead, response slowed as the shift wore on — 6.1 minutes in hour two versus 14.1 minutes in hour eight. So the mechanism may be fatigue and workload as much as sheer alert count. The practical takeaway survives either way: tune your thresholds, kill the repeats, and do not claim a universal law. A tripwire that cries wolf gets muted, and a muted tripwire is worse than none — it is false confidence.
The risks and honest caveats
Five is a scaffold, not a law. The point is decision-anchored and few, not literally five. A team with a genuinely different decision surface might need four or six. If you find yourself adding a seventh report “for completeness,” you have probably stopped mapping decisions and started collecting data again.
Beware the McKinsey mirage. You have seen the stat everywhere: “data-driven companies are 23 times more likely to acquire customers, 6 times more likely to retain them, and 19 times more likely to be profitable.” The widely repeated “6 times retention” is a corruption. McKinsey’s actual 2013 DataMatics survey of roughly 400 senior executives, published in 2014, found intensive users of customer analytics were 23 times more likely to clearly outperform on new-customer acquisition, nine times more likely to outperform on customer loyalty, and almost 19 times more likely to achieve above-average profitability. The loyalty figure is 9, not 6 — and these are self-reported likelihoods from a survey, not a controlled experiment. Cite them carefully or not at all.
Watch the stale-threshold risk. A trigger line set once and never revisited drifts out of alignment with the business. Thresholds need their own review cadence, or the tripwire starts firing on last year’s reality.
And respect the data-quality dependency. A decision-anchored report is only as good as its inputs. Garbage in used to be garbage displayed; now it is garbage decided — a higher-stakes failure, because a bad number that triggers a bad budget move does real damage. This is also where the money question lives. MIT CISR’s 2024 Data Monetization Survey of 349 executives found top performers attributed 11% of revenue to data monetization, more than five times the 2% reported by bottom performers. The researchers’ sharpest point: creating value and realizing value are different things. “A core activity that separates a real return from applause,” they write, “is the practice of measurement: routinely tracing created value to a specific line item on the income statement.” Your five reports are exactly that tracing mechanism — or they should be.
One more reality check on the tooling. Gartner’s 2025 Marketing Technology Survey found teams using just 49% of their stack’s purchased capability — a partial recovery from the 33% low of 2023, but still well below the 58% of 2020 — and only 15% of organizations qualified as high performers meeting strategic goals with positive ROI. Half of what you pay for sits idle. The fix is not another tool; it is using the five reports you already have the data for. And remember what the testing culture piece showed: at Bing, a small headline change shelved for months as low priority turned out, once someone finally ran a controlled test, to lift revenue 12% — worth about $100 million a year in the U.S. alone. The value was never in having the idea. It was in having a mechanism that forced the idea to be tested and acted on. That is what a decision-anchored report is.
Conclusion: fewer reports, sharper triggers
Most marketing teams do not have a data problem. They have a deciding problem, buried under forty reports, none of which moves anything. The five reports that matter — steering, allocation, flow, compounding, and the tripwire — are the ones that route data to decisions, each on the right cadence, each with a named owner and a written trigger.
Build them from the decision outward. Attach a threshold and an owner to each. Automate only the exception. Retire the rest. The payoff is not a prettier dashboard — it is the 5–6% productivity edge that comes from deciding differently, and the 11%-of-revenue discipline of tracing value to a real line item. Fewer reports, sharper triggers: that is data analysis that actually changes what the team does next.