Most A/B Tests Lie. Sample Size and Patience Are the Cure.
Here’s a scene you’ve probably lived. The dashboard glows green on day four. The new checkout button is up 8 percent, confidence 97 percent, and someone in Slack is already typing the champagne emoji. You ship it. Two months later, the conversion rate is exactly where it started. What happened?
The idea didn’t fail. The measurement did.
Most A/B tests are broken before the first visitor arrives — not because the ideas are bad, but because the statistics underneath them were never decided. Teams launch tests on traffic that can’t possibly detect the effect they hope to see, then check results daily and declare a winner on noise. Two disciplines fix nearly all of it: deciding your sample size up front, and having the patience to run to it. That’s the whole playbook. Unglamorous? Absolutely. Effective? It’s the difference between a growth program and a slot machine with a dashboard. (If you’ve read our companion piece on building a testing culture that compounds, this is the statistical foundation that culture runs on.)
Before we go further, one clarification that saves a lot of confusion: none of this is an argument against testing. It’s an argument against testing badly. The companies that run the most experiments on earth — Microsoft, Google, Booking.com — are also the companies most obsessive about the statistics underneath them. The rigor is what makes the velocity safe. Skip the math and “move fast” just means “be wrong faster.”
Why Most A/B Tests Lie
The Peeking Problem
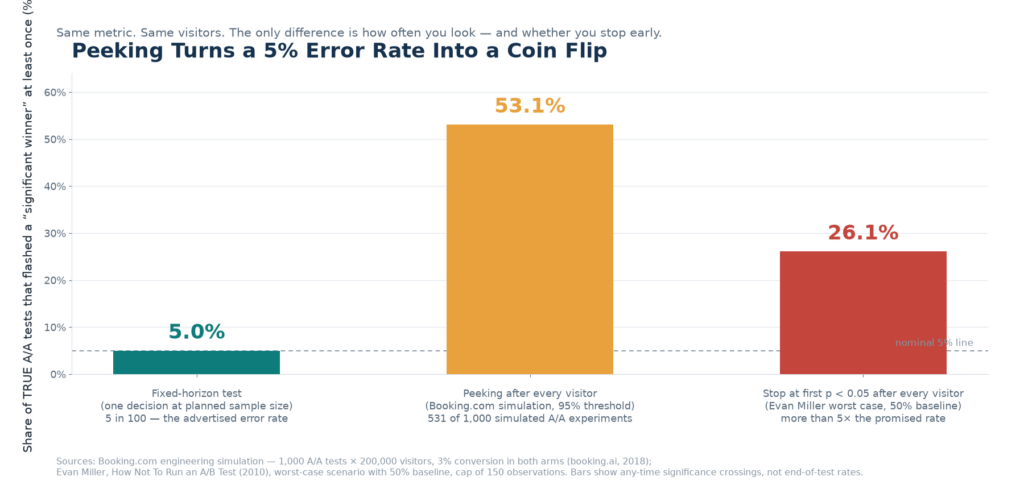
Checking a test every day and stopping when it looks significant is the single most common way to fool yourself — and it’s not a small error. Evan Miller’s classic 2010 analysis showed that in a worst-case scenario (50 percent baseline conversion, checking after every single visitor, stopping at the first significant result), the false-positive rate balloons to 26.1 percent — more than five times the 5 percent the dashboard promises. His other warning is just as sharp: peek ten times during a test, and what you think is 1 percent significance is actually about 5 percent.
Booking.com’s engineering team demonstrated the same disaster at scale. In a 2018 simulation published on its engineering blog, they ran 1,000 A/A tests — identical variants, zero real difference — each with 200,000 simulated visitors converting at 3 percent. When they checked significance after every visitor, 531 of the 1,000 tests flashed a “significant winner” at the 95 percent level at some point. When the decision was made only once, at the pre-planned sample size? Just 51 — almost exactly the advertised 5 percent. Same data. Same metric. The only difference was how often they looked. (Booking.com is itself an experimentation platform operator, but this is a reproducible simulation, not a product claim.)
The Underpowered Problem
The second lie is quieter: a flat result usually means “the test was too small,” not “there was no difference.” A test run on too little traffic isn’t neutral — it’s blind. And when a blind test happens to flash green, it doesn’t just miss the truth; it exaggerates it. We’ll get to the mechanics, because they’re brutal.
Think of it like a scale that only reliably reads weights above ten pounds. Put a nine-pound package on it and the needle barely moves — that doesn’t mean the package is weightless. It means your instrument was never built for the question you asked. Most marketing tests are that scale, weighing gram-sized effects.
The Metric-Fishing Problem
Third: test twenty metrics and highlight whichever one crossed p < 0.05, and you’ve built a false-positive factory. The arithmetic is simple — twenty independent tests at a 5 percent threshold give you a 64 percent chance that at least one “win” is pure noise. Optimizely’s Stats Engine whitepaper documents the same logic with its own example: five comparisons at a 10 percent threshold produce a 41 percent overall false-positive chance. (Optimizely sells the sequential-testing engine that fixes this, so treat its framing as vendor-informed — the math, however, is textbook.)
So here’s the reframe: A/B testing is a measurement discipline before it’s a growth tactic. Get the statistics right, or your conclusions are fiction with confidence intervals.
One more distinction worth keeping straight: relative versus absolute. A “10 percent lift” on a 5 percent baseline means going from 5.0 to 5.5 percent — a half-point absolute change. Every number in this article is relative unless stated otherwise. Mixing the two is how teams accidentally order a test that needs ten times their annual traffic.
The Three Numbers You Must Decide First
Baseline Conversion Rate
The first number is your anchor: the current conversion rate on the exact metric you’re testing. Everything downstream — sample size, duration, feasibility — is computed from it. Guess this number and every later number is a guess too.
And pick the metric before you look at any results, not after. If you measure signups, your baseline is your signup rate — not your click-through rate, not your add-to-cart rate. Swapping metrics mid-flight to find a nicer-looking number is metric-fishing wearing a lab coat.
Minimum Detectable Effect (MDE)
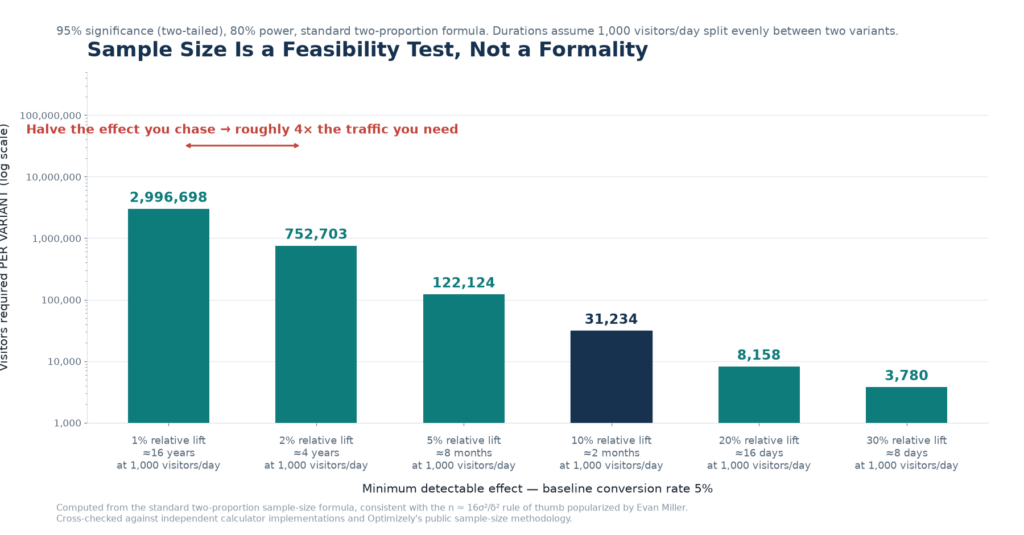
The second number is the lever with the biggest consequence: the minimum detectable effect, the smallest lift actually worth shipping. Here’s the part most teams miss — the MDE is a business decision disguised as a statistic. “What lift would make this change worth the engineering cost?” is a question for your P&L, not your calculator. Set it too small and you’ve quietly committed your test to run for quarters. The sample-size law is unforgiving: halve the effect you want to detect and you need roughly four times the traffic. Eppo’s experimentation documentation states the rule verbatim: to detect an effect twice as small, you need four times as much data.
Power and Significance
The third pair of numbers is the industry standard: 80 percent power and 95 percent significance (α = 0.05). Power is your chance of catching a real effect of MDE size or larger; significance caps your false-positive rate at 5 percent — but only if you honor the other rules. Eighty percent power means one in five real wins will slip through undetected. That’s the accepted price. What’s not acceptable is running at 20 percent power and pretending the test was a fair fight.
Why 80 and not 95? Because power is expensive. On a 5 percent baseline with a 10 percent relative lift, pushing power from 80 to 95 percent raises the required sample from about 31,200 to about 51,700 per variant — roughly two-thirds more traffic for the same effect. The 80 percent convention is a negotiated trade-off, not a law of nature. What matters is that you choose it deliberately, write it down, and never quietly lower the bar after seeing the data.
Sample Size Is a Feasibility Test
What the Calculator Tells You
Plug baseline, MDE, power and significance into any reputable sample-size calculator and it answers the only question that matters: can your traffic afford this test at all? At a 5 percent baseline with 95 percent significance and 80 percent power, the standard two-proportion formula gives roughly 31,200 visitors per variant for a 10 percent relative lift — about two months at 1,000 visitors per day split evenly between variants. Drop the MDE to 5 percent and you need about 122,000 per variant — eight months. Chase a 1 percent relative lift and you’re looking at roughly 3 million per variant: sixteen years. The math doesn’t negotiate.
The Revenue-Metric Trap
Conversion is the easy case. Revenue-per-visitor is a heavy-tailed monster: most visitors spend nothing, and one whale order can swing the entire result. Experimentation platforms like Eppo document this explicitly and recommend two fixes — winsorizing extreme values (clipping at the 99th or 99.9th percentile) and CUPED, the variance-reduction technique Microsoft researchers introduced at WSDM 2013 using pre-experiment data. The honest takeaway: revenue tests need substantially more data than conversion tests, and running one on conversion-sized traffic is a classic silent failure. There’s no universal multiplier — the variance of your own revenue distribution decides.
Scope Control, Not a Wall
When the calculator says “sixteen years,” you have exactly three honest options: raise the MDE to something your traffic can detect, accept a longer timeline, or stop testing that metric on that traffic. Sample size isn’t a wall — it’s scope control. Teams that treat it as an inconvenience to be ignored are the ones shipping noise.
There’s also a fourth, smarter option the mature platforms use: reduce the noise instead of raising the sample. Variance-reduction techniques like CUPED can cut required sample sizes dramatically by using each visitor’s pre-experiment behavior as a baseline. That’s engineering, not magic — but it’s the legitimate way to buy sensitivity when traffic is scarce.
The Discipline of Patience
Pre-Register the Design
Write down the primary metric, the MDE, the power, the significance level and the stop rule before launch. The decision is made while the test is still honest — before you have any emotional stake in a particular arm. This is the experimentation version of pre-registration in clinical trials, and it works for the same reason: it removes your future self’s ability to cheat.
Commit to a Stop Time
Run to the pre-committed sample size, not to the moment the dashboard looks good. If you genuinely must monitor — for guardrail metrics or business reasons — use sequential-testing methods that account for repeated looks. Optimizely’s Stats Engine is one production implementation, combining sequential testing with Benjamini-Hochberg false-discovery-rate control; the underlying always-valid inference framework was published by Johari, Pekelis and Walsh in 2017. The point isn’t which vendor you pick — it’s that peeking without correction is never a neutral act.
And “done” means the planned sample size, not the planned date. If traffic comes in slower than forecast, the test runs longer — that’s the commitment working as designed. Calendar-driven stopping (“we need an answer before the board meeting”) is peeking with a deadline attached.
One Primary Metric
Declare one primary metric early. Everything else is context and hypothesis-generation, never a winner-declaration. Twenty metrics, twenty chances to be fooled — the 64 percent bill comes due whether you acknowledge it or not.
Protect Against External Noise
Run full-week cycles: weekday and weekend visitors behave differently, and Optimizely’s own guidance recommends at least one to two complete business cycles. And run the sample-ratio mismatch (SRM) check — a chi-square test that your traffic actually split 50/50 as intended. Kohavi, Tang and Xu devote an entire chapter of their Cambridge University Press book Trustworthy Online Controlled Experiments to SRM as a trust guardrail, and a Microsoft-and-Booking.com team published a practitioner taxonomy at KDD 2019. Why so much attention? Because broken randomization poisons everything downstream, and it happens more than anyone admits.
The cautionary tale is public. In 2024, the researchers behind the Upworthy Research Archive — 32,487 real headline A/B tests donated to science — published a correction in Nature Scientific Data: a caching bug between June 25, 2013 and January 10, 2014 had broken random assignment for 7,004 tests, 22 percent of the entire archive. Their advice to researchers: exclude all of them. A quarter of a famous dataset, quietly invalidated by an infrastructure bug nobody checked for.
The Winner’s Curse: Why Early “Wins” Evaporate
Here’s the mechanism behind every “winner” that dies in production. When a test is underpowered, the only way it can reach significance is if random noise happens to push the estimate upward — so significant results from weak tests are systematically inflated. This is the winner’s curse, and it’s now quantified. In a KDD 2026 paper built on eight large-scale replications, Kohavi, Linowski, Vermeer and colleagues report the expected exaggeration of significant results: about 13 percent at 80 percent power, 40 percent at 50 percent power, and a staggering 130 percent at 20 percent power — a factor of 2.3. A true 1 percent lift, “detected” by a badly underpowered test, gets shipped as a 2.3 percent lift. Then reality collects the difference.
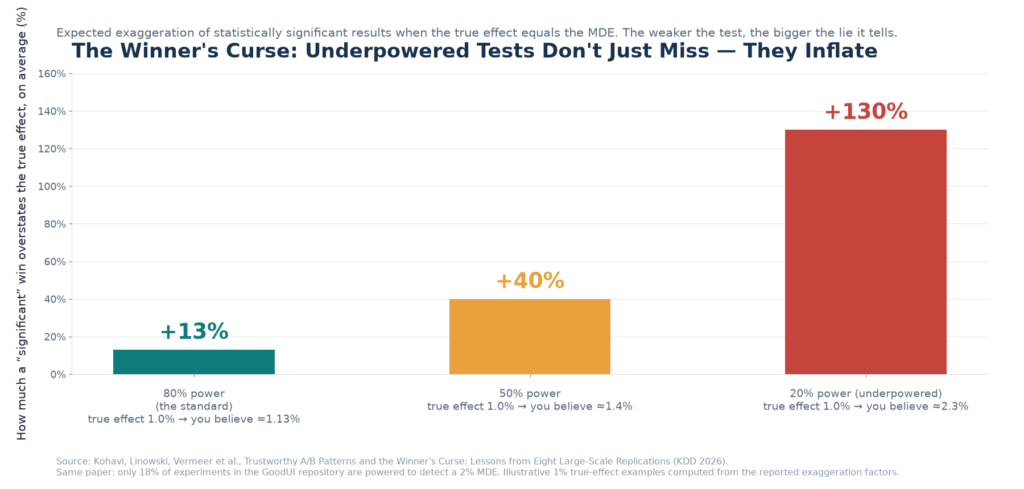
The same research group’s companion paper shows how rare adequate power actually is: in the GoodUI repository of publicly shared A/B tests, only 18 percent of experiments are powered to detect even a 2 percent MDE. Most public “winners” are statistically incapable of telling a real effect from a lucky week.
The Rounded-Corners Story: A 55% Lift That Wasn’t
Still think this is academic? Consider the most cited recent example. A study in the Journal of Consumer Research (Biswas, Abell and Chacko, published online 2023, in print 2024) reported that rounding the corners of a call-to-action button lifted click-through by 55 percent, p = 0.037. The sample: 919 visits.
Kohavi, Linowski and colleagues ran three replications, each with more than 2,000 times the users — millions of visitors per test. The effects came back at 0.16 percent, 0.29 percent and 0.73 percent: roughly two orders of magnitude smaller than the original claim, and none statistically significant. The original “55 percent lift” was a small-sample fluctuation that got published, celebrated, and copied into a thousand design systems. This is exactly what sample size and patience are for.
The uncomfortable lesson isn’t that researchers are careless — it’s that the incentive system rewards surprising, publishable lifts over honest nulls. Your growth team has the same incentive structure: a bold “winner” gets a Slack celebration; a careful “we couldn’t detect anything” gets an awkward silence. Sample size and patience are the defenses against that pressure, not just against bad math.
Risks and Honest Caveats
Significant but Pointless
A result can be mathematically significant and still below your business MDE. With enough traffic, a 0.02 percent lift becomes “significant” — and still not worth the code change. Significance is necessary; it is not sufficient. The decision threshold lives in your business case, not in the p-value.
The Small-List Dilemma
When traffic genuinely can’t support a proper test — small email lists, niche B2B pages — the honest moves are to aggregate across sends or periods, test a higher-frequency proxy metric, or simply decide without pretending you ran an experiment. What you must not do is run a 400-person test and report a winner. That’s not data; it’s theater.
The Portfolio Bill
Run too many underpowered tests across your program and the false positives compound at portfolio level. Optimizely’s own retrospective — vendor data, self-reported, no independent audit — re-ran 48,000 historical experiments and found fixed-horizon statistics declared winners or losers in 36 percent of tests, versus 22 percent under its corrected engine; about 80 percent of the dropped “conclusions” came from underpowered tests. Read that as a vendor’s argument for its product, yes — but also as a mirror: most of what your dashboard calls “conclusive” may be noise with good lighting.
The Alibi Test
The subtlest failure: running a test to defend a decision already made on instinct. Testing to confirm, not to decide, wastes the very patience the method demands — and turns your experimentation program into an expensive rubber stamp. If the decision is already made, save the traffic and say so.
The Takeaway
A/B testing done right has almost nothing to do with clever ideas and everything to do with two unglamorous disciplines: deciding the sample size up front, and running with the patience to reach it. Name the three numbers — baseline, MDE, power. Pre-register the design. Run to the committed end. Keep one primary metric. Check the split. And when the dashboard glows green on day four, remember the 531 ghost winners out of 1,000 identical tests, the 55 percent button lift that evaporated at scale, and the 22 percent of a famous research archive that turned out to be broken. Test to decide, not to confirm — and let the math, not the green glow, be your evidence.