China Does Not Lack Data. It Lacks Comparability.
Every quarter, someone walks into a boardroom with a China slide and gets away with it. The chart is clean. The source is real. The number is real. But the claim attached to it is wrong, often by a factor of two, because two or three different definitions have been blended into a single sentence.
China is not short of data. It is short of comparability. Platforms publish, panels measure, the state counts, and the trade press estimates. Yet all four speak the same vocabulary — GMV, users, growth — as though the words meant the same thing everywhere. They do not.
The damage rarely arrives as a scandal. It arrives as a plan: a media budget sized against a market that was counted gross; a launch calendar built on a growth rate whose base period quietly shifted; a board paper claiming that a category grew 82 percent in a year when two of its three biggest members shrank.
This guide is about the unglamorous work: how to decide, in about ninety seconds, whether a Chinese number is a fact, an estimate, or a press release with a percentage glued on. It offers twelve rules, one rating table, and a habit that could save your next pitch.
The short version
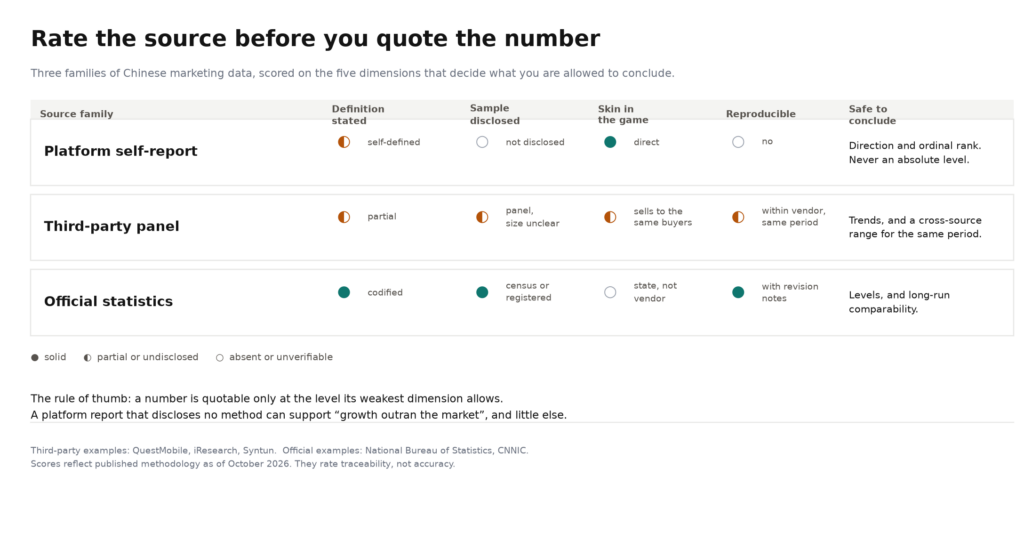
- China’s marketing data comes in three families. Platform self-report, third-party panels, and official statistics each answer a different question. None can substitute for another.
- Platform numbers run high by construction. GMV counts orders placed, not money kept. Paid GMV is not settled GMV, and settled GMV is not the merchant’s revenue.
- Two credible institutions can disagree by hundreds of millions of users and both be right. QuestMobile counts standalone AI apps. CNNIC counts anyone who used a generative feature inside any product.
- One year, three growth rates. Douyin’s 2024 e-commerce growth has been published as 46 percent, 35 percent, and 30 percent. Each figure holds up inside its own time window.
- A ratio without a denominator is decoration. Livestream’s share of Douyin’s GMV lands somewhere between 50 and 60 percent, depending on how it is counted. The published figures do not add up to 100 percent.
- The fix is a footnote, not a fact-check. Put the definition, period, denominator, and collector beside every number. It takes ten seconds, and it is the only defense that will hold up on a diligence call.
1. Three families of data, and why they never substitute for each other
The first skill is not skepticism. It is sorting. Almost every Chinese marketing number you will see belongs to one of three families, and that family determines what the number can prove.
Platform self-report. Annual reports, festival war reports, and merchant ecosystem releases. They offer enormous coverage, no audit, and a commercial interest in the direction of the numbers. A festival release might tell you that 120,000 merchants doubled their livestream sales during the mid-year shopping festival, that 570,000 creators doubled theirs, and that merchants whose coupon-driven livestream sales topped RMB 1 million grew 152 percent. Each of those statements may be true. None of them tells you the platform’s total sales.
Third-party panels. QuestMobile, iResearch, Syntun, and their peers. These firms sell measurement, so their survival depends on being roughly right, and their clients include the platforms they measure. A panel is a sample, and a sample makes a claim about a population. Published methodologies tend to say what was measured, less often how large the panel was, and almost never how participants were recruited.
Official statistics. The National Bureau of Statistics and the China Internet Network Information Center. These figures are slow, codified, and sometimes revised; their definitions sit in documents anyone can read. If you need a level, this is the family to consult. If you need a trend inside a category, official statistics usually cannot help, because they count industries rather than platforms.
The mistake people make is treating these three families as different versions of the same thing. They are not three estimates of one truth. They are three instruments aimed at three different objects. A sentence that takes a level from one and a growth rate from another is not a synthesis. It is a chimera.
Here is the practical test: ask what would have to be wrong for the claim to collapse. If the answer is “the total market,” you are holding a panel number and should not make a level claim. If the answer is “whether anyone bought anything,” you are holding a platform number and should not make a market-share claim.
2. Why platform numbers run high, and by how much
No one in this market lies about GMV the way a fraudster lies. They use a generous definition, and that generosity compounds.
Start at the top. GMV is the value of orders placed. It is recorded when an order is placed — not when the parcel arrives, not when the customer decides to keep it, and not when the merchant gets paid. In categories with high return rates, the gap between orders placed and items kept is the single largest adjustment in the whole chain.
Next comes paid GMV, the term Chinese platforms actually use in their own disclosures. It excludes orders that were never paid for, which sounds rigorous until you remember that payment is not possession. A returned order was paid for.
Then comes settled GMV, after refunds and cancellations. This is the figure a finance team cares about, and the one almost nobody publishes.
Finally, there are net receipts to the merchant, after commission, subsidy clawbacks, and the ad spend that bought the traffic in the first place. This is the figure that shows up in a brand’s profit and loss statement, and it is typically the smallest of the four by a wide margin.
Each step down the ladder is a legitimate measure. The error is choosing one rung and calling it the market.
There is a second inflation channel that Western readers often miss: subsidies. Chinese platforms run large coupon programs and merchant support schemes, and those coupons are reflected in transaction value. In the first eight months of 2025, one major platform reported paying out more than RMB 19 billion in merchant subsidies, and separately claimed more than RMB 32 billion in merchant cost savings from fee waivers, commission relief and logistics support over the preceding year. Those figures describe different things. One is cash paid out; the other is cost avoided. They get quoted side by side as though they were the same achievement, and neither is revenue.
The honest version is short: platform GMV is a demand signal, not a market size. Use it to rank. Never use it to size.
3. What QuestMobile, CNNIC, and an annual report can each answer
Three sources, three very different jobs. Confusing those jobs is one of the most common ways a competent analyst ends up with an indefensible slide.
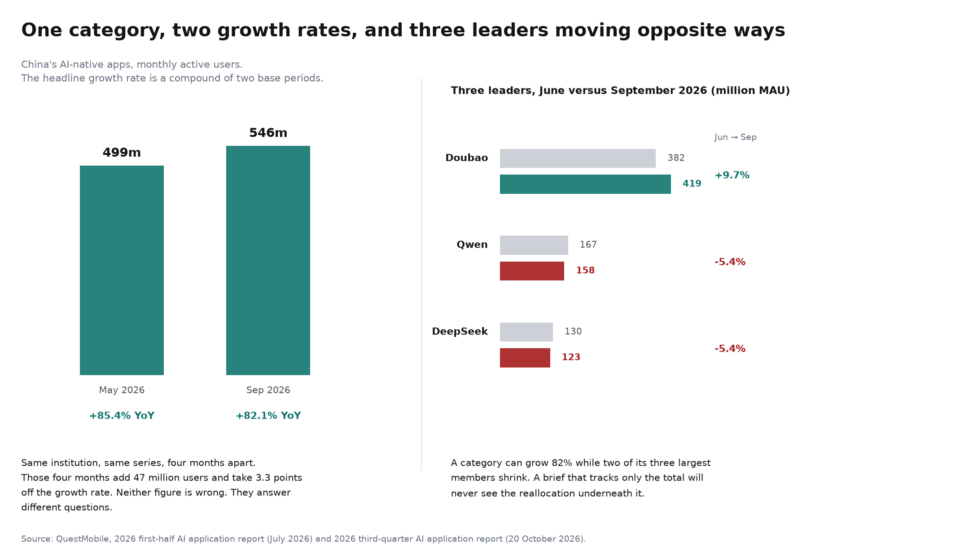
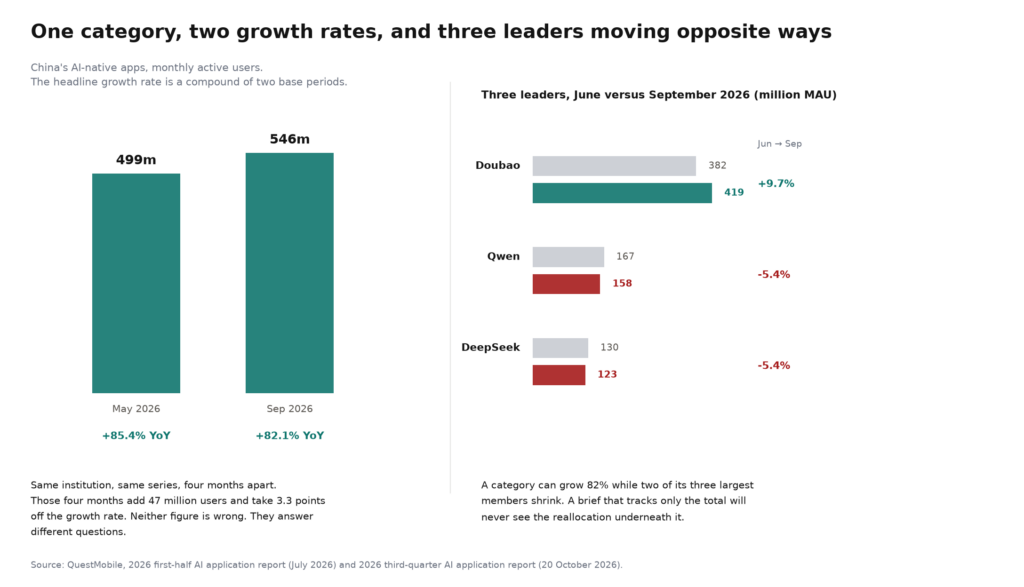
QuestMobile answers questions about app behavior. Its September 2026 release put China’s AI-native apps at 546 million monthly users, up 82.1 percent year on year, with 88.2 sessions and 173.5 minutes per user per month. Four months earlier, the same firm’s half-year report had put the same category at 499 million, up 85.4 percent.
That pair is worth a closer look. The category added 47 million users in four months, while the growth rate fell 3.3 points. Neither figure is wrong. They answer different questions, and a deck that quotes only the 82.1 percent rate is citing a rate already four months behind the user level it describes.
QuestMobile cannot tell you how many people in China use AI. It can tell you how many opened an app with its own icon on a home screen. That is a narrower question, and a more useful one than most people realize, because it is the question media planning actually needs answered.
CNNIC answers questions about the national population of internet users. Its 2026 generative AI report put the user base above 700 million, with a penetration rate above 50 percent. Its release note does not say what that rate is measured against. That is not evasion; it is the ordinary looseness of a statistical release written for a domestic audience that already knows the denominator.
An annual report answers questions about disclosed financials, and only disclosed financials: revenue, take rate, and marketing expense. Not GMV, because GMV is not a line item in a financial statement and never has been.
So: buying media, use the panel. Sizing a national habit, use the state. Building a valuation, use the filing. A paragraph that quotes all three and implies they corroborate each other does not make your case stronger. It makes it easier to break.
4. The festival trap: base effects and calendar drift
Festival growth figures are among the most quoted and least comparable numbers in Chinese marketing. Two mechanisms do most of the damage, and both are arithmetic rather than malice.
Base effect. A platform that grew 220 percent in 2022 cannot keep growing at 220 percent a year. The denominator gets heavier each year. A growth rate that falls from 80 to 46 to 30 to under 20 across four years describes a maturing platform, not a failing one. And the same 20 percent figure means something very different in year two of a boom than it does in year seven.
Calendar drift. Chinese shopping festivals no longer fit neatly into a week. One autumn campaign ran for 57 days, opening in mid-September and spanning both a public holiday and the Singles’ Day window. A 57-day campaign compared with a 30-day campaign is not a like-for-like comparison. No release will tell you the window changed unless you go looking.
There is a third mechanism specific to this market and almost invisible from outside. Official online retail is reported as two lines — goods and services — and they do not move together. From January to August 2026, online retail of goods reached RMB 8.42 trillion, up 4.3 percent; online retail of services reached RMB 5.06 trillion, up 5.1 percent; together they reached RMB 13.48 trillion, up 4.6 percent. Total retail sales in the same eight months were RMB 32.76 trillion, up 1.1 percent, while August alone grew 0.4 percent. Anyone quoting “online retail growth” without saying which of those three lines they mean has produced a number with three possible values and no clear owner.
The rule for festivals is unglamorous: never compare one festival with another. Compare the festival month with the same month last year, and compare the platform with the total market in the same window. If August retail grew 0.4 percent and a platform grew 20 percent, that gap is the story. The festival headline is not.
5. How to read one number from one platform
Take the most quoted structural claim in Chinese e-commerce: livestream’s share of Douyin’s sales. You will see it cited as roughly 60 percent, and you will see the arithmetic behind it change depending on who is talking.
Here is what was actually published, all of it in reports issued during 2025.
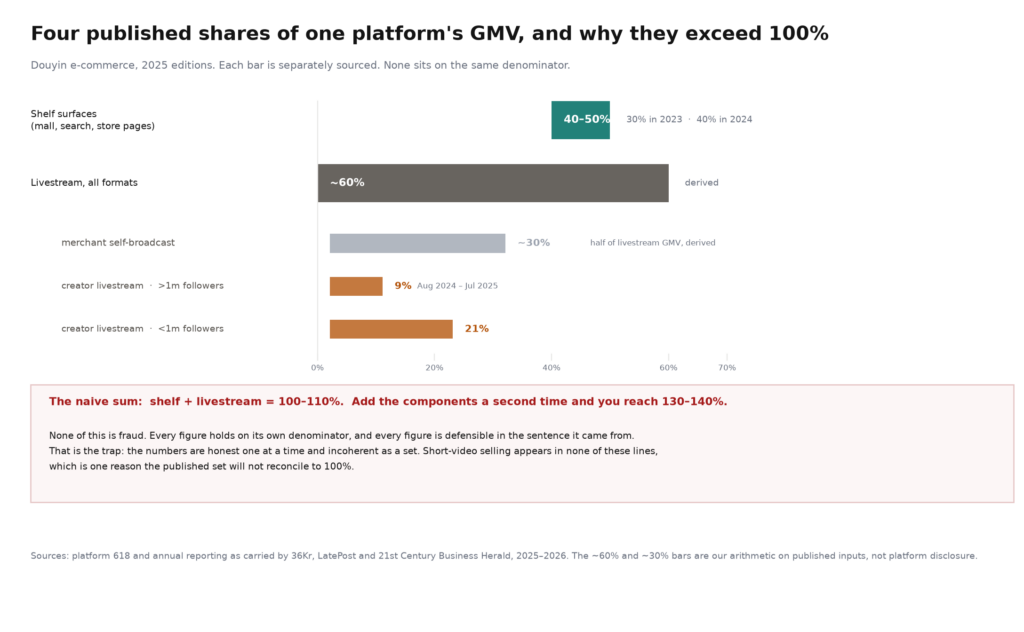
Shelf surfaces — the mall, search, and store pages — were reported to account for about 30 percent of GMV in 2023, about 40 percent in 2024, and close to 50 percent during the 2025 mid-year festival, when shelf sales alone were put at roughly RMB 200 billion.
The trade press broke creator livestream down into about 9 percent of GMV from creators with more than a million followers and about 21 percent from everyone with a smaller audience. That means 30 percent of GMV moved through creators.
During the same 2025 festival, about half of the sales driven by livestream came from merchants broadcasting their own stores rather than from creators. If creator livestream accounts for roughly 30 percent of GMV and about half of livestream sales, then all livestream accounts for roughly 60 percent, with merchant self-broadcast making up the other 30 percent.
Add the shelf share to the livestream share and you get 100 to 110 percent. Add the creator share again as a separate item, as most decks do, and you reach 130 to 140 percent.
Nothing in that stack is a lie. Shelf share, livestream share, and creator share were each measured against their own denominator and inside their own window. In some cases short-video selling was included; in others it was not. The set is internally incoherent because it was never designed to function as a set.
Two lessons follow. First, when someone quotes a share of a platform’s GMV, ask which denominator and which window they mean. Second, when the components miss 100 percent by 30 points, you are not looking at rounding. You are looking at a taxonomy nobody gave you.
One supporting figure is worth knowing, because it shows how fast the mix shifts beneath a stable headline. In 2025, the number of merchants growing revenue through their own store broadcasts rose 45 percent year on year, and more than 10,000 small and mid-sized merchants passed RMB 10 million in self-broadcast sales. The platform’s total growth was decelerating over the same period. The mix was moving faster than the market.
6. RMB, USD, 亿, billion: the unit problem
Currency conversion is the easiest place to lose a factor of 10, and people do it in public.
First, the exchange rate. At roughly RMB 7.1 to the dollar, RMB 1 trillion is about USD 141 billion. State the rate you used and the date you used it. Otherwise a three-year-old deck with an unstated rate is a three-year-old number wearing a new suit.
Second, Chinese magnitude words do not map neatly onto English ones. 亿 is one hundred million. 万亿 is one trillion. RMB 8,362 亿 is RMB 836.2 billion, not RMB 8.362 billion. The distance between those two readings is a factor of a hundred, and the error shows up in real published decks every year.
Third, make the currency of the claim explicit. A platform’s GMV is in RMB. A parent company’s revenue may be reported in USD. A bank’s forecast may use either. When you build a chart from three sources in two currencies, convert all of them at one rate on one date — or do not draw the chart.
Fourth, and this one survives all the others: a unit is not a definition. RMB 4 trillion of GMV and RMB 4 trillion of retail sales are not comparable, because one counts orders and the other counts transactions that cleared. Same currency, same magnitude word, different universe.
7. The five-question source check
Ninety seconds. Five questions. A source that fails two of them does not go in the deck.
One: what exactly is being counted? Orders, payments, settlements, users, sessions, or revenue? If the answer is “GMV” and nothing more, you still have a question to ask.
Two: over what window? A calendar year, rolling twelve months, a festival window, or a single month annualized? Rolling windows are the most common source of accidental flattery: a strong half-year dragged into a rolling twelve-month period can make a mediocre year look robust.
Three: measured or reported? A panel measures. A platform reports. A regulator counts. Three different verbs, three different error profiles.
Four: who paid for it? A report commissioned by the seller of the thing being measured is not disqualified, but it should be downgraded. Say so out loud instead of pretending the question never came up.
Five: could I reproduce it? Not the number — the method. If the method is not described, the number is an assertion. Assertions are fine in a pitch and fatal in a plan.
Two worked examples. A festival release announcing that 120,000 merchants doubled their livestream sales: the counted object is unclear, the window is clear, the figure is reported rather than measured, the platform paid for it, and the method is undisclosed. That is one pass out of five, which means you can quote the number as a directional signal and nothing else. A national statistics release on online retail of goods: the counted object is codified, the window is explicit, the figure is counted rather than measured, the state funded it, and the method is published and revised. That is five out of five, which means you can build a market-size estimate on it.
8. Red flags: the tells that cost you the meeting
Some numbers announce their own weakness before you check anything.
Round numbers with no source. “China’s livestream market is worth RMB 5 trillion.” A round number attached to a total market, in a country where platforms do not publish audited totals, is usually a consultant’s extrapolation wearing a citation-free suit.
A percentage with no base. “Up 300 percent” is a claim about a base. If the base is small enough, the absolute number is irrelevant and the percentage is theater.
A growth rate with no period. This is the most common defect in translated decks. Douyin’s 2024 e-commerce growth has been published as 46 percent, 35 percent, and 30 percent across three credible outlets, on three different windows. All three have circulated as “Douyin’s growth last year.”
Translated decks that keep the Chinese unit and drop the Chinese definition. The number survives translation; the caveat does not. That is how a slide ends up arithmetically correct and commercially wrong at the same time.
A ratio whose numerator and denominator come from different reports. Extremely common in AI decks, where a category total from one panel is divided by an internet-population figure from another, and the result is presented as a penetration rate.
Two platforms owned by one company, counted as one. In the first half of 2026, China’s internet advertising market was put at RMB 385.34 billion, up 7.1 percent. The top three media by hard-advertising share were Taobao at 22.8 percent, Douyin at 18.7 percent, and Qianchuan at 14.6 percent. Qianchuan is ByteDance’s ad platform. Whether those two lines can be added into a single corporate share depends entirely on the report’s own category logic. A deck that adds them without reading the note has probably double-counted.
9. When the vendor’s own report is the right source
There is a version of skepticism that is as wrong as credulity. It rejects every platform number and substitutes a pundit’s guess with no method at all. That is not rigor. It is a downgrade.
A platform report is the right source in five situations.
When you need the platform’s own strategy signal. If a company says it will prioritize merchant self-broadcast over creator livestream for a year, that statement is the strategy. Its truth value is not the point; the behavior that follows is the evidence.
When the number is a count rather than a value. The number of merchants that crossed a threshold, the number of creators who doubled their sales, the number of categories opened. Counts are harder to inflate than values, because inflation requires actual entities.
When the claim is ordinal. “Faster than the market” can survive a generous definition. “Worth RMB 4.4 trillion” cannot.
When it supplies a denominator you cannot get anywhere else. Platform releases are the only public source for some category-level splits, and a dirty denominator beats no denominator, as long as you label it dirty.
When the direction of the bias is known and stable. If every release from a given source runs 10 to 20 percent hot in the same direction, you can use the series to track the trend and adjust the level.
What you must never do is use a vendor report as the level in a document that someone will use to decide about that level. Directional use, labeled; level use, forbidden.
10. Build the table before you build the deck
Every team that works on China regularly ends up with the same artifact. It is not a dashboard. It is a small table, six columns wide, that travels with every number you will ever quote.
The columns are metric, definition, denominator, period, collector, and permitted conclusion. Six fields per row, and the last one is the one that saves you.
Start with four rows.
Row one. Metric: AI-native app monthly active users. Definition: a standalone app with its own icon. Denominator: not stated. Period: September 2026. Collector: third-party panel. Permitted conclusion: media reach inside apps.
Row two. Metric: generative AI users. Definition: anyone using a generative feature in any product. Denominator: not stated in the release. Period: first half of 2026. Collector: state-backed internet statistics body. Permitted conclusion: national habit sizing, with the denominator caveat stated.
Row three. Metric: e-commerce GMV. Definition: orders placed and paid. Denominator: none. Period: calendar 2025. Collector: platform, via trade press. Permitted conclusion: ranking and direction only.
Row four. Metric: online retail of goods. Definition: codified retail series. Denominator: national. Period: January to August 2026. Collector: national statistics office. Permitted conclusion: market size and year-on-year comparison.
The table does two jobs. It stops you mixing rows, and it gives a junior colleague a way to check your work without asking you. The second job matters more, because the person who challenges your number in the meeting is usually not you.
11. Two credible sources, one number, opposite conclusions
The clearest way to see the problem is to watch two respected institutions disagree about something as simple as how many people in China use AI, then notice that neither is wrong.
Source A, a state-backed internet statistics body, reports more than 700 million generative AI users as of the first half of 2026, with a penetration rate above 50 percent. Source B, a commercial measurement panel, reports 546 million monthly users of AI-native apps as of September 2026.
Put those figures side by side and a reasonable reader might conclude that one of the sources is badly wrong. The gap is more than 150 million people.
Now take them apart. Source A counts a person once if they used a generative feature anywhere, including in a search box, a map, a shopping app, or a phone’s built-in assistant. Source B counts a person once if they opened an app that exists to be an AI app. Different populations, different instruments, different months.
Both are decision-grade for the questions they were built to answer. Source A answers “how mainstream is this?” Its answer: more mainstream than in most Western markets. Source B answers “how big is the audience I can buy inside an app?” Its answer: 546 million, with a defined shape.
The failure mode is not quoting either figure. It is dividing one by the other. Take 546 million and divide it by 1.28 billion monthly internet users, and you get about 43 percent. That looks like a penetration rate, but it is a ratio between two reported metrics with unstated denominators. Present it as penetration and a numerate client will correctly take the whole slide apart in front of everyone.
One more example, because it is the same disease in a different organ. Douyin’s e-commerce growth for roughly 2024 has been published at 46 percent, 35 percent, and 30 percent. Each figure came from a defensible source. Each reflected a different window. The 46 percent was a twelve-month window described in a platform keynote; the 35 percent was a calendar year quoted by a company executive; the 30 percent was a calendar year reported by the trade press. Three true numbers, one phrase, no agreement.
When you see this, do not pick the middle one. Pick the figure whose window matches your model, and write that window into the cell.
12. The footnote habit that will save your proposal
Here is the whole method, reduced to something you can do in a meeting.
Every number in your deck gets one line underneath it, in small gray type, with four pieces of information: what was counted, over what period, by whom, and against what denominator. That is it. Twelve words, usually fewer.
It looks like housekeeping. It functions as armor. Three things happen once you start doing it.
You stop using numbers you cannot describe. Half the bad numbers in circulation survive only because nobody was ever asked to write their definition in public.
Your client stops asking whether the number is real and starts asking whether it is the right number. That is a better conversation, and one you can win.
And when someone in the room quotes a different figure from a different source, you do not have to defend yours. You can put both on the table and show why they differ. That is a much stronger position than being right by accident.
The habit costs ten seconds per number. The alternative costs a quarter of planning against a market that was counted wrong.
Bottom line
China’s marketing data is abundant, published, and almost entirely incomparable across sources. That is not a scandal. It is a structural feature of a market where platforms are also media owners, panels sell to the companies they measure, and the state counts industries rather than apps.
The practical discipline is narrow. Sort every number into a family before you believe it. Ask what was counted, over what window, by whom, and against what denominator. Make a level claim only with a source that publishes a method, and treat everything else as a directional claim. When two credible sources disagree, resist the urge to pick a winner. Explain the difference instead, because that explanation is what your client is actually paying for.
The number was never the problem. The sentence was.
FAQ
Is Chinese marketing data unreliable?
No, and that framing will get you into trouble. Most of it is reliable for the question it was built to answer. The failure is cross-use: treating a platform’s paid GMV as a market size, or a panel’s app audience as a national population. Reliability is a property of the pairing between a number and a claim, not of the number alone.
What is the difference between GMV, paid GMV, and net receipts?
GMV is the value of orders placed. Paid GMV excludes orders that were never paid for, but still includes orders later returned. Net receipts, after refunds, commission, subsidy clawbacks, and ad spend, are what the merchant keeps. Each rung is smaller than the one above it. In high-return categories the gap between the first and the last is large enough to turn a growth story into a margin story.
Why do two respected sources disagree by hundreds of millions of users?
Because they count different populations. A state statistical release counts anyone who used a generative feature inside any product, once. A commercial panel counts people who opened a standalone AI app. Those are not two estimates of one number. They are two measurements of two different things, published months apart, and both are legitimate for their own purposes.
Can I trust a platform’s own annual report?
For strategy, yes. For counts, usually. For levels, no. Platform releases are the only public source for some category splits, so rejecting them outright leaves you with worse options. Use them for direction and ranking, label them as self-reported, and never let one become the market size in a document where someone will spend money on the strength of it.
What is the single fastest check I can run before a meeting?
Read the sentence, not the number. If the sentence contains a metric with no definition, a ratio with no denominator, or a growth rate with no period, you have found the defect in under ten seconds. Nine out of ten bad China slides fail that test on the first read.