Spending More, Growing Less: What the 2026 Mobile Ad Rankings Actually Mean.
Nine of the Ten Biggest Mobile Ad Channels Spent More This Year. That Is Not the Same as a Growing Market.
AppsFlyer changed how it ranks media sources. The new method turns a league table into a map of where budgets are actually going.
AppsFlyer published the 2026 edition of its Performance Index, and the most consequential change was methodological. For the first time, the index measures quality using quarter-over-quarter change in ad spend instead of retention — a deliberate pivot from a behavioral proxy toward a number advertisers cannot hide.
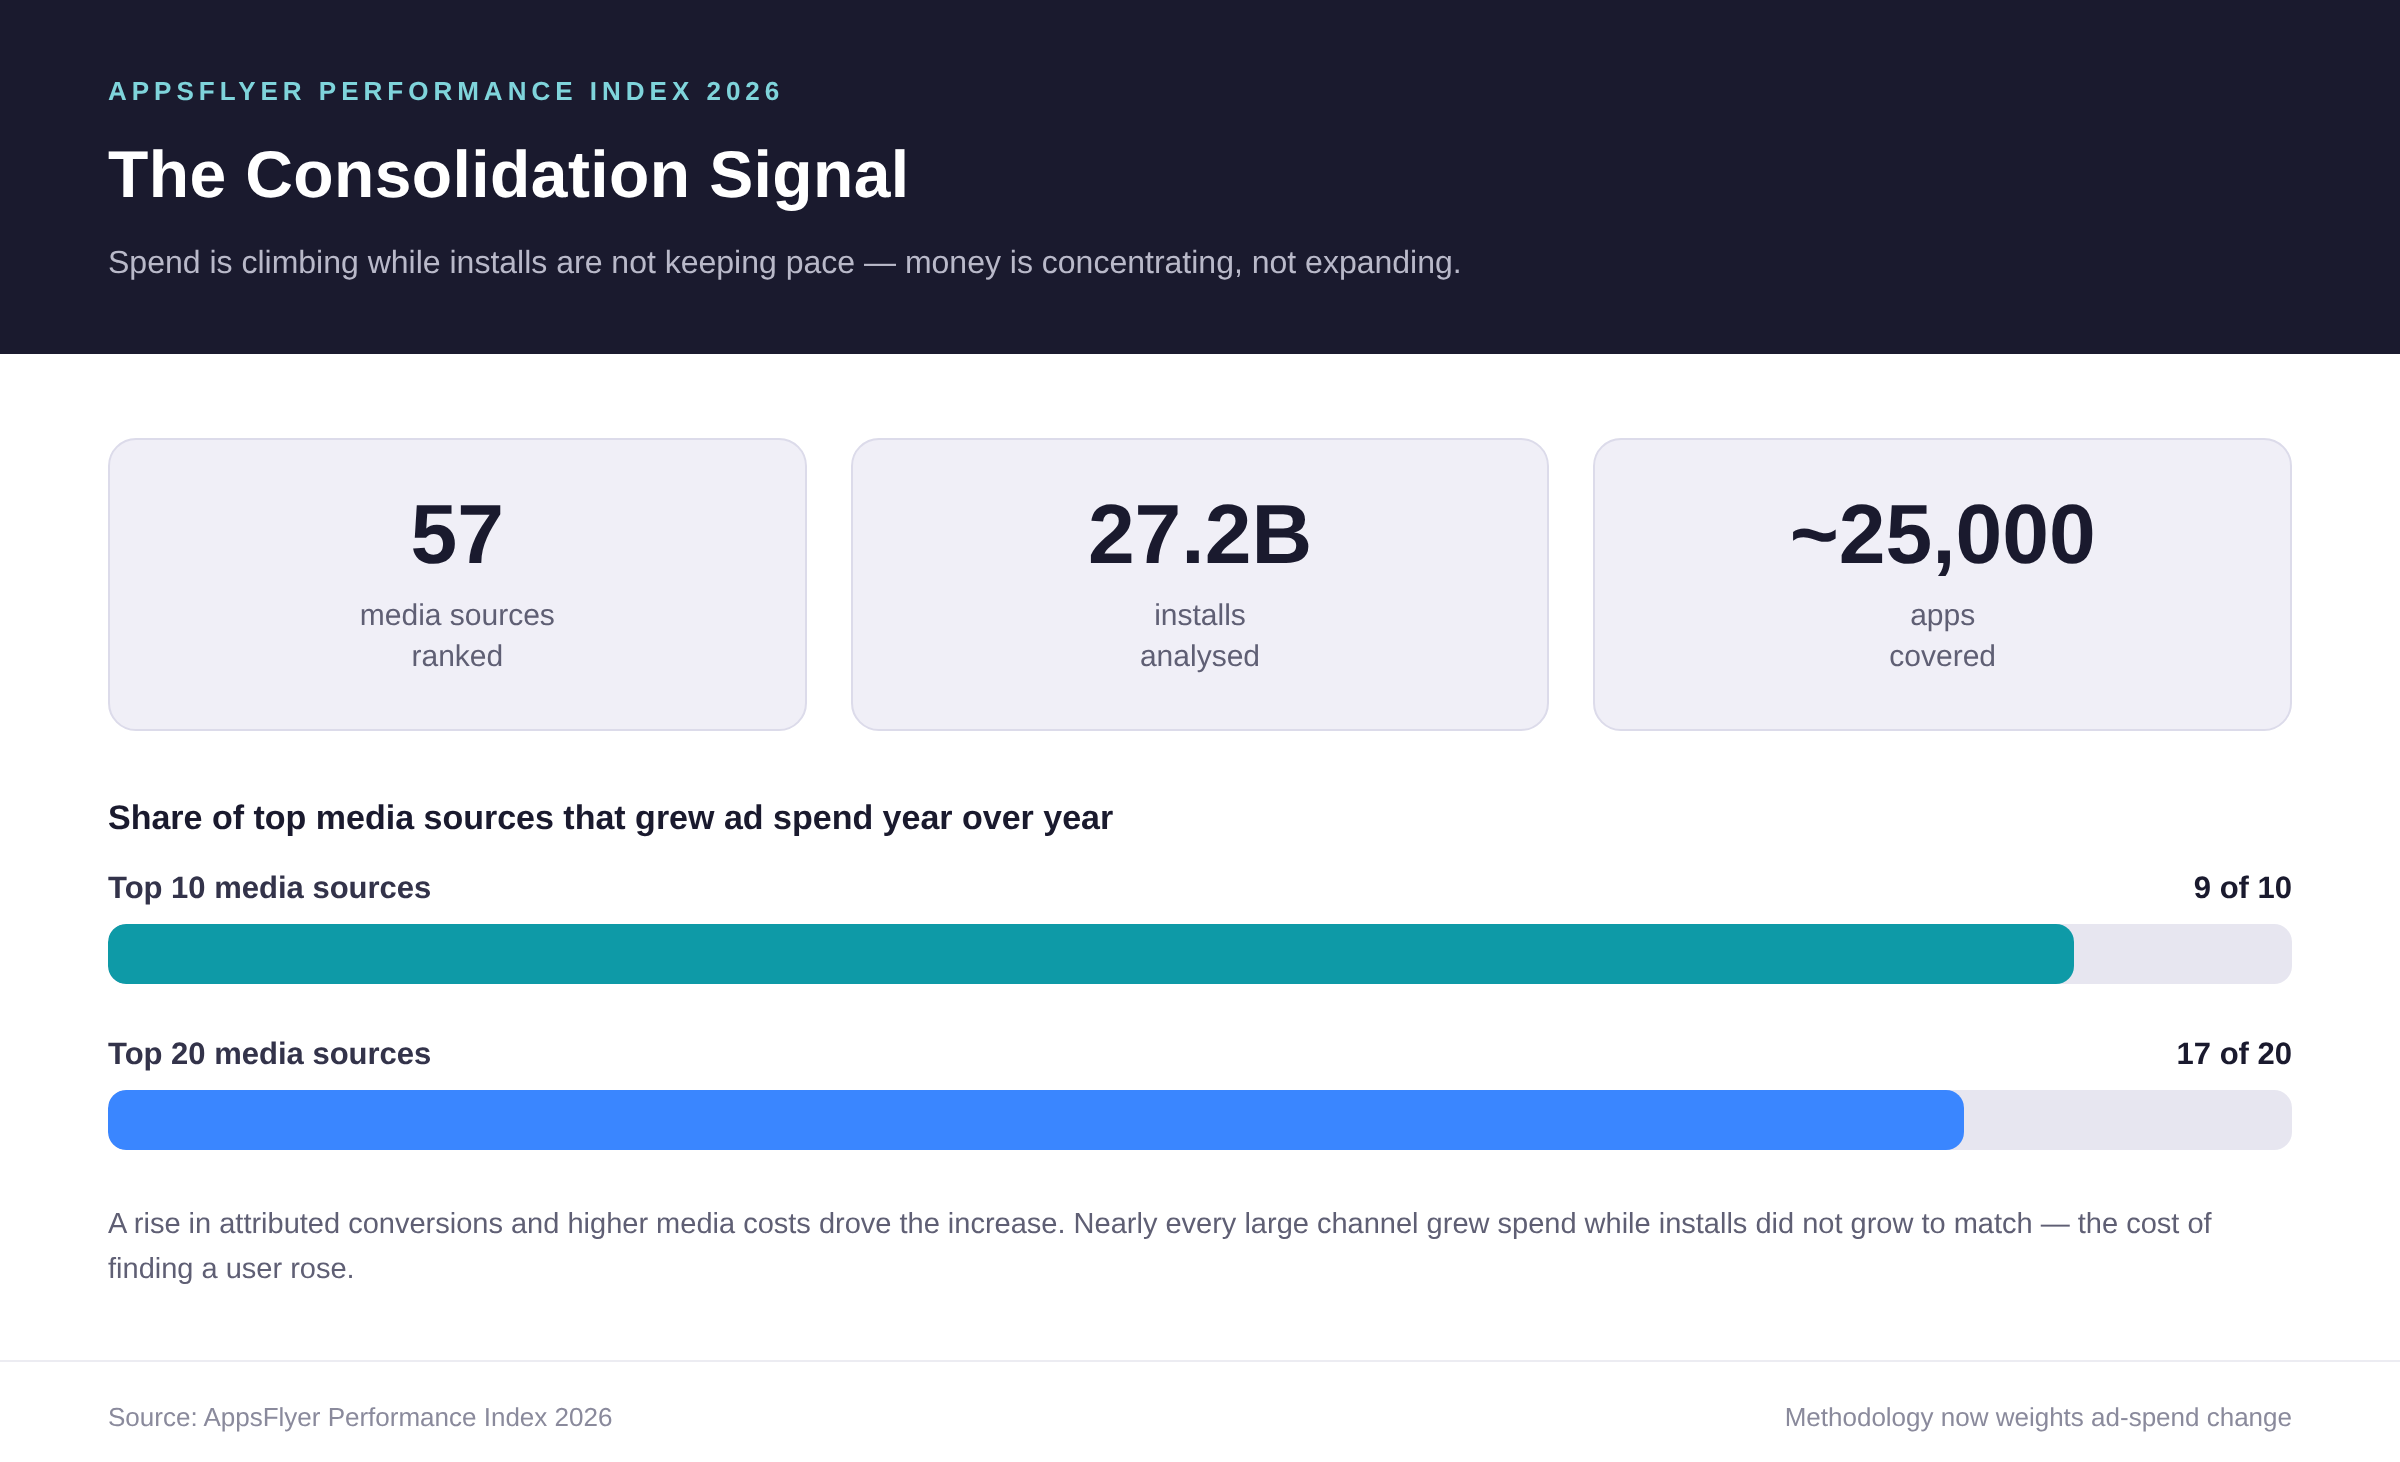
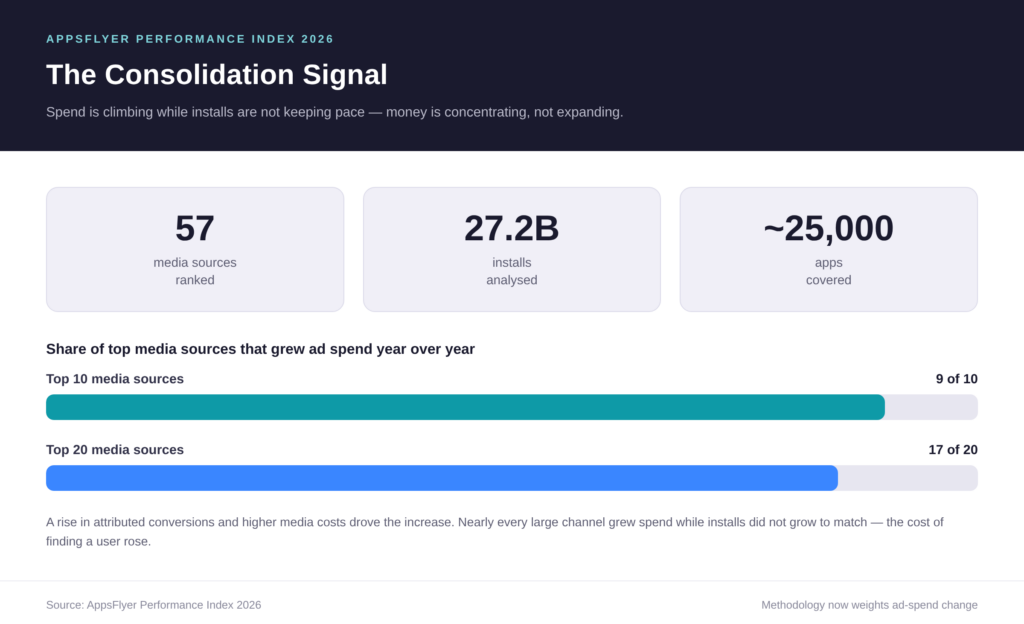
The headline finding: nine of the top ten media sources increased ad spend year over year, and seventeen of the top twenty did the same. The rise was driven by a combination of more attributed conversions and higher media costs. In total, the index analyzed 27.2 billion installs from nearly 25,000 apps to rank 57 media sources.
Read that as consolidation rather than expansion. Money is shifting between channels and concentrating in the ones an advertiser can defend in a budget review. A market where nearly every large channel grew spend while installs did not grow to match is a market where the cost of finding a user rose.
Why the methodology change matters
Retention-based quality scores were the industry’s default for years, but they were always soft. A quality score built on post-install behavior depends on event tracking that Apple’s App Tracking Transparency framework has steadily degraded. Ad-spend change is different: it is observable, hard to fudge, and reflects a decision that has already been made.
Weighting rankings by spend change does something subtler, too. It recenters the index on intent — where money is actually committed — rather than on volume, which can be bought cheaply and flattered by fraud. The practical result is a report that reads less like a league table and more like a capital-flow statement.
What the rankings actually say
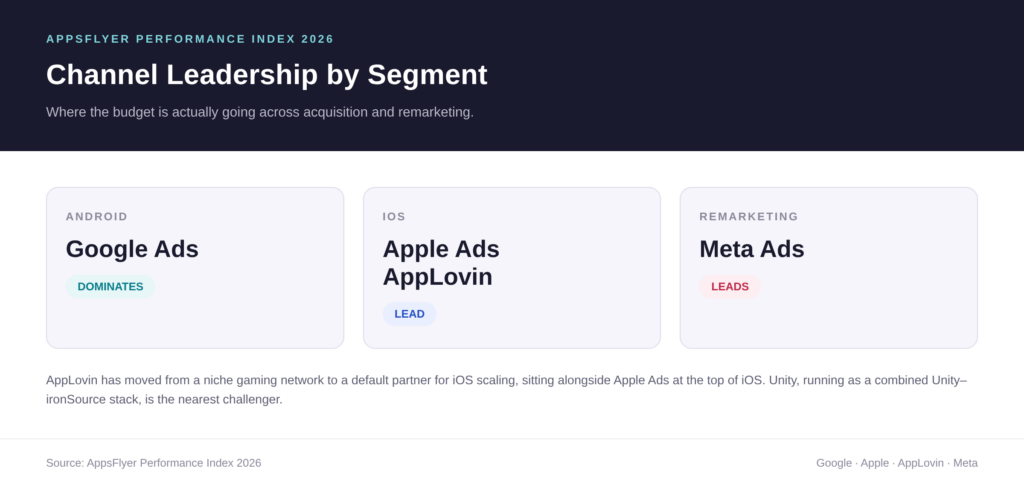
Google Ads and Apple Ads held their ground. Google dominates Android, while Apple Search Ads and AppLovin take the lead on iOS. Meta Ads leads remarketing, a category that quietly carries a growing share of the account.
The most telling movement is AppLovin’s. It has graduated from a niche gaming network to a default partner for iOS game scaling, and it now sits alongside Apple Ads at the top of the iOS rankings. Unity, running as a combined Unity–ironSource stack, is the nearest challenger.
For anyone planning emerging-market growth, the device-maker cohort matters more than the headlines suggest. Xiaomi, vivo, and OPPO each run ad platforms that many Western media plans still treat as an afterthought.
The OEM shift is the one to watch
Device-maker ad platforms were long treated as a route to preinstalls rather than a real budget line. That is changing for reasons unrelated to ad-tech fashion.
On Android, discovery increasingly happens on the device itself rather than in a search box or a social feed: in the launcher, the app store, notification surfaces, and the recommendation layers shipped with the operating system. If that is where attention sits, that is where attribution has to work — and OEM platforms sit closer to those surfaces than any independent network.
For app marketers entering markets where a handful of device brands hold large share, the implication is concrete. Plans built only on global networks under-report a growing share of installs, and the blind spot widens as OEM inventory matures. Under the new spend-weighted methodology, that blind spot is more visible than it has ever been.
Retargeting is carrying the account
Meta Ads’ lead in remarketing follows from where retargeting demand lives: the apps that already have an audience and now have to make it pay.
This is what a mature acquisition market looks like. When the cost of a new install rises and the supply of new users does not, budgets move toward the audience already installed. Retargeting is cheaper per conversion in most categories, easier to attribute, and difficult to argue against in a quarterly review.
The catch is decay. Re-engaging the same users repeatedly produces excellent short-term numbers and a shrinking pool. Apps leaning on it without fixing onboarding and retention are borrowing against their own future.
Where the creative supply is going
One category deserves separate mention because it explains a chunk of the spend movement: short drama. The format has become a genuine budget reservoir, and its appetite for creative is unusual.
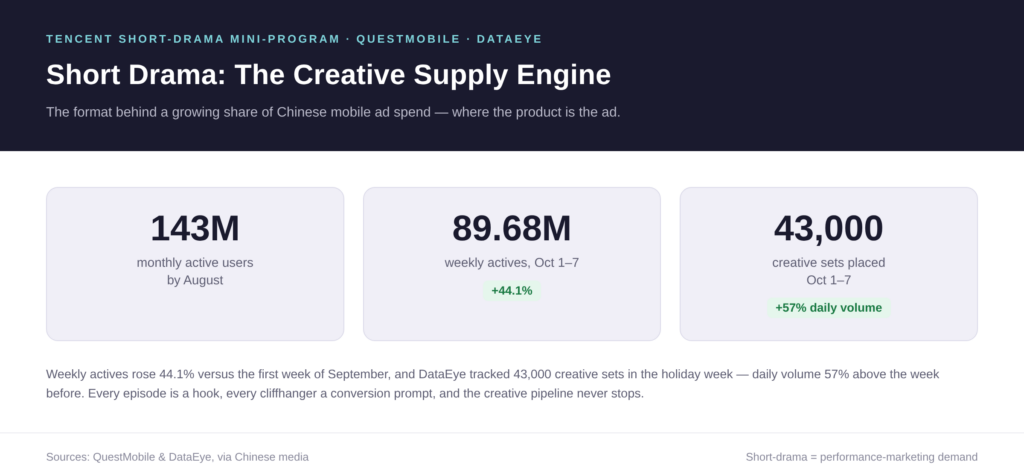
Tencent’s short-drama mini-program inside WeChat — renamed in July — reached 143 million monthly active users by August, according to QuestMobile monitoring. In the first week of October, weekly actives hit 89.68 million, up 44.1 percent on the first week of September. DataEye’s ad-monitoring data tracked 43,000 creative sets placed between October 1 and 7, with daily volume 57 percent above the week before the holiday.
Short drama is a category where the product is the ad. Every episode is a hook, every cliffhanger a conversion prompt, and the creative pipeline must run continuously. That makes it one of the largest consumers of performance-marketing assets in the Chinese mobile market — and it explains why spend keeps flowing there while headline growth slows.
Three things to re-check
Audit channel coverage before channel performance, because a media plan without OEM inventory is measuring the wrong universe. Separate new-install efficiency from retargeting efficiency in reporting, since blended numbers hide which one is actually carrying the account. And stop treating creative volume as a constant, because categories built on serialized content need production capacity that most media plans never budget for.
Key numbers
- Media sources ranked: 57
- Installs analyzed: 27.2 billion
- Apps covered: nearly 25,000
- Top-10 media sources growing ad spend year over year: 9 of 10
- Top-20 media sources growing ad spend year over year: 17 of 20
- Short-drama monthly actives by August: 143 million
- Short-drama weekly actives, October 1–7: 89.68 million, +44.1% on the first week of September
- Short-drama creative sets, October 1–7: 43,000, daily volume +57% versus the pre-holiday week
Bottom line: The index describes a market where budgets consolidate into channels that can prove return — with device-maker inventory and retargeting absorbing the shift. Growth in spend is not growth in demand. The useful question is no longer which channel is biggest, but which channels are invisible in your current attribution.