CTV Ads: The Measurement Mess and the Opportunity
Imagine a media director closing a twelve-million-dollar CTV buy across four streamers, three device platforms, and a handful of FAST channels. Six weeks later the client asks the only question that matters: how many households did we reach, and how many times did each one see us?
She has four dashboards, four definitions of a view, four different household counts, and no answer. The campaign looks like a success on every slide she can build. Nobody can say what it actually did.
That is not a failure of effort. It is the default state of connected TV advertising in 2026 — a channel that inherited television’s audience, television’s budget, and almost none of television’s shared accounting.
The money arrived before the measurement did
Here is the part that makes the mess so irritating: it is wrapped around a genuinely excellent product.
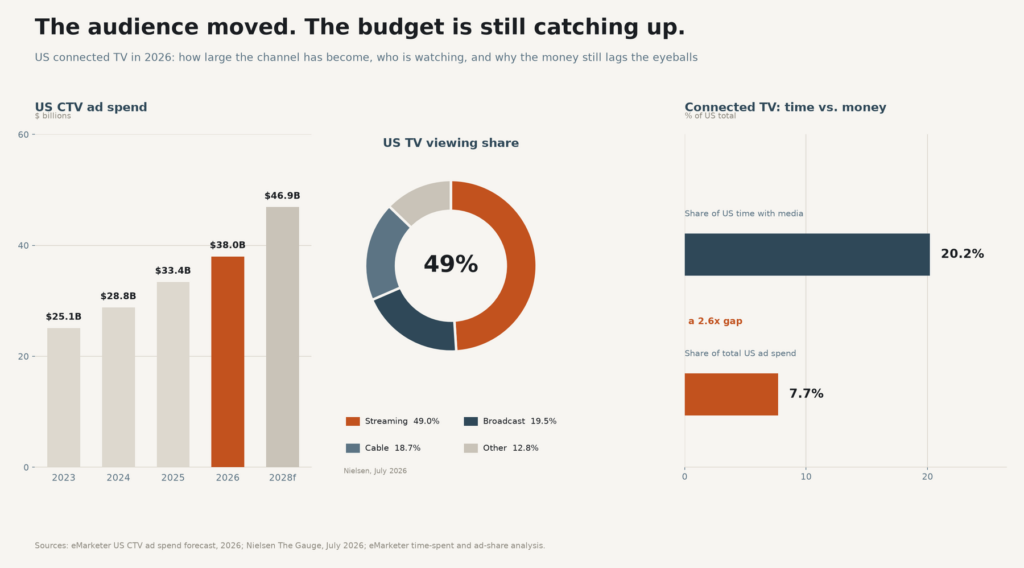
US CTV ad spend lands near $38 billion this year, up roughly 14 to 15 percent, and CTV upfront commitments passed primetime linear for the first time — $17.73 billion against $16.98 billion. Forecasts put the channel close to $47 billion by 2028, at which point it overtakes traditional television outright.
The audience got there first. Nielsen’s July 2026 Gauge report put streaming at 49 percent of US television time, a record, with broadcast at 19.5 percent and cable at 18.7 percent. YouTube alone absorbed 14.2 percent of all TV viewing that month, nearly double Netflix’s 7.8 percent. Europe is running the same migration on a two-year delay: CTV ad views grew 33 percent year over year in the first half of 2026 and now account for 53 percent of premium video ad views there.
So the eyeballs moved, the budgets followed, and the accounting did not. CTV still captures around 20 percent of the time Americans spend with media and roughly 8 percent of total ad spend. That gap is not a rounding error. It is the single largest underweighted pool of premium reach left in video.
Why does the money lag? Not inertia. Buying CTV well is operationally hard in a way that buying search simply is not. You are stitching together dozens of supply sources, each with its own reporting logic, its own identifier, and its own definition of what counts as a view. The result is a channel that behaves like television and reports like nothing at all.
Four messes, and only one of them is expensive
The industry talks about “the CTV measurement problem” as though it were a single defect. It is at least four, and they cost different amounts.
Mess one: the platform is plural
A cross-platform CTV campaign is not one buy. It is fifteen buys wearing a trench coat. Roku, Samsung Ads, Amazon, Netflix, Disney, YouTube, a dozen FAST services — each sells separately, reports separately, and optimises against its own targets. No single dashboard sees the whole campaign, and nobody is accountable for the number that would actually matter: deduplicated household reach.
Mess two: no common currency
Linear television had something CTV lacks. For decades, one rating from one vendor functioned as the lingua franca of a multi-billion-dollar market. Everyone could argue about the number because everyone was arguing about the same number.
CTV never inherited that. Each seller reports against its own measurement stack, so a buyer comparing a Hulu placement to a Roku placement to a YouTube placement is comparing three numbers built on three methodologies. Comparability is not a nice-to-have here. It is the precondition for moving budget.
Mess three: the same household, counted ten times
This is where the money actually leaks, and it is misunderstood almost everywhere.
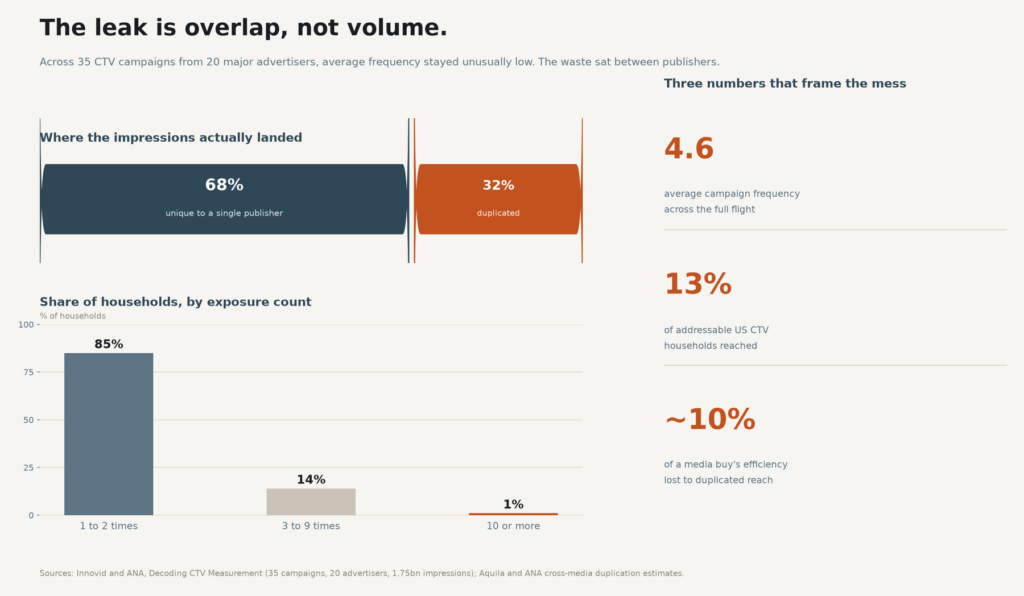
The most-cited benchmark remains the Innovid and ANA study of 35 campaigns from 20 major advertisers — 1.75 billion impressions, roughly $35 million in spend. Its findings run against the industry’s favourite complaint. Average campaign frequency was 4.6, not sixteen. Eighty-five percent of households saw the ad once or twice. The frequency panic, the authors argued, was “highly exaggerated.”
What the same study found underneath that comfortable average is the real problem: an average duplication rate of 32 percent across publishers. Read that carefully. The waste was not one publisher running the ad too often. It was the same person being counted separately on platforms that never compared notes.
That study ran campaigns in early 2021, and the addressable base has grown since. A larger universe makes shallow reach a bigger problem, not a smaller one.
Mess four: sold as digital, delivered as television
CTV was pitched as television you could finally count. Impression-level data, household targeting, closed-loop attribution. What many advertisers received was television-grade opacity in a digital costume.
A near-perfect completion rate on a 15-second spot tells you the ad played. In a room with three people and two phones, it tells you almost nothing about whether anyone noticed, remembered, or cared.
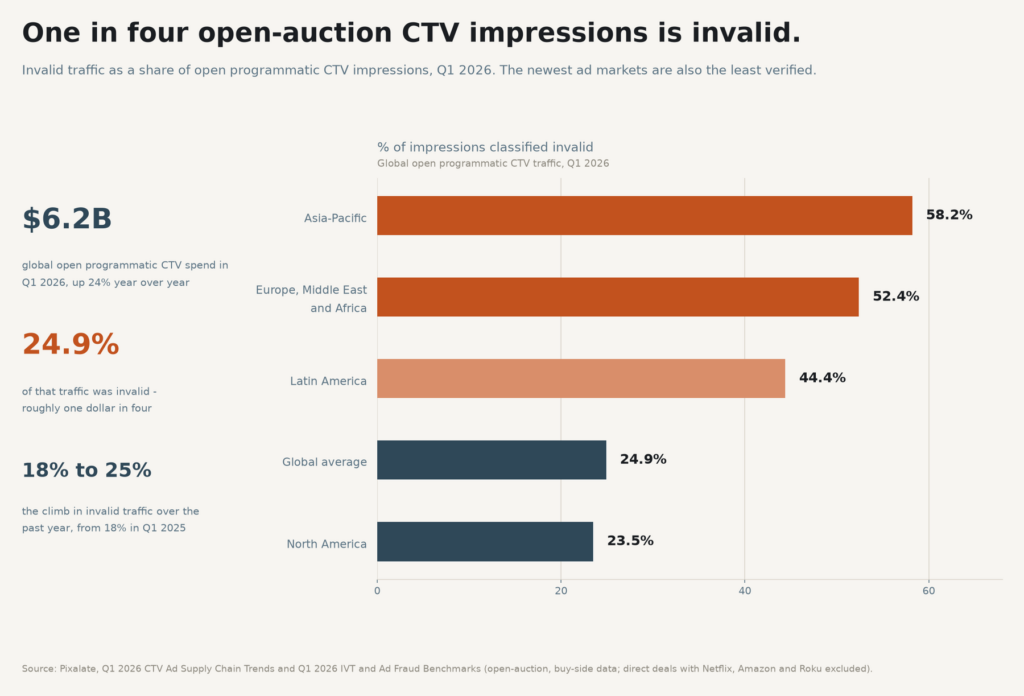
Then there is the plumbing itself. Pixalate’s Q1 2026 analysis of open programmatic CTV traffic found 24.9 percent of impressions invalid — up from 18 percent a year earlier. Regional spread is worse than the average suggests: 58.2 percent in Asia-Pacific, 52.4 percent across Europe, the Middle East and Africa, 44.4 percent in Latin America, and 23.5 percent in North America. Platform-level rates range from 15 percent on Amazon Fire TV and 16 percent on Roku to 40 percent on LG and 36 percent on Samsung.
Read that alongside the growth rate — programmatic CTV spend up 24 percent year over year after just 10 percent the prior year — and a pattern emerges: money is arriving in new markets faster than verification capacity. This is open-auction data, so direct deals with the biggest streamers sit outside it. Which is rather the point. The cleanest inventory is the inventory nobody can buy at auction.
Why it stays broken
If the fix were a better dashboard, it would have shipped years ago. The obstacles are structural.
The gardens have no reason to open
Every major streamer’s ad business rests on proprietary audience data. Cross-platform deduplication requires sharing that data with competitors and with independent measurement firms. The incentive runs the other way, and no amount of industry goodwill reverses an incentive.
Identity is the actual bottleneck
Here is the unglamorous truth: cross-platform frequency is an identity problem before it is a media problem.
A CTV platform caps frequency against a household graph. A programmatic desktop buy caps against a cookie. A mobile app caps against an advertising ID. None of those keys is the same key. Set a cap of three on each surface and your true cross-screen frequency can reach nine before any single report looks wrong.
That is why an average of 4.6 and a duplication rate of 32 percent can both be true at once. The number that got reported was accurate for the surface it measured. The household lived on several surfaces.
The currency war is a transition, not a failure
Since 2023 the US Joint Industry Committee has been certifying measurement providers as national currencies against buyer- and seller-defined criteria. In September 2026 it re-certified Comscore, iSpot and VideoAmp for the 2026–2028 term and published a report explaining how each one actually builds an audience estimate.
That is genuine progress, and it is also why your reporting looks worse right now. Two currencies mean two numbers. Two numbers mean someone has to explain the variance in a meeting. The transition is not evidence the system failed — it is what a functioning market looks like while it is being rebuilt.
Privacy changed the plumbing on purpose
The rules reshaping digital advertising did not spare CTV. Household graphs, cross-device joins and clean rooms now operate inside consent boundaries that deliberately introduce aggregation thresholds, delay and noise. Treating those as defects to engineer around is a misread. They are the design.
What is actually working
Strip out the conference-circuit optimism and five things are genuinely moving.
One number, or close to it
The JIC’s certification work matters less for the specific vendors than for the mechanism: an independent body, agreed criteria, published methodology. Legibility is where comparability starts.
A framework that admits what it cannot see
In October 2026 IAB Europe published its final CTV Measurement Framework and Transparency Principles, and its most useful contribution is not a metric. It is a dependency structure.
A clean, valid impression forms the foundation. Everything else — reach, completion, conversions, ROAS, attention — sits on top. Invalid traffic, a television that was powered off, or one supply source sold by several resellers does not merely distort a single number. It contaminates everything built above it.
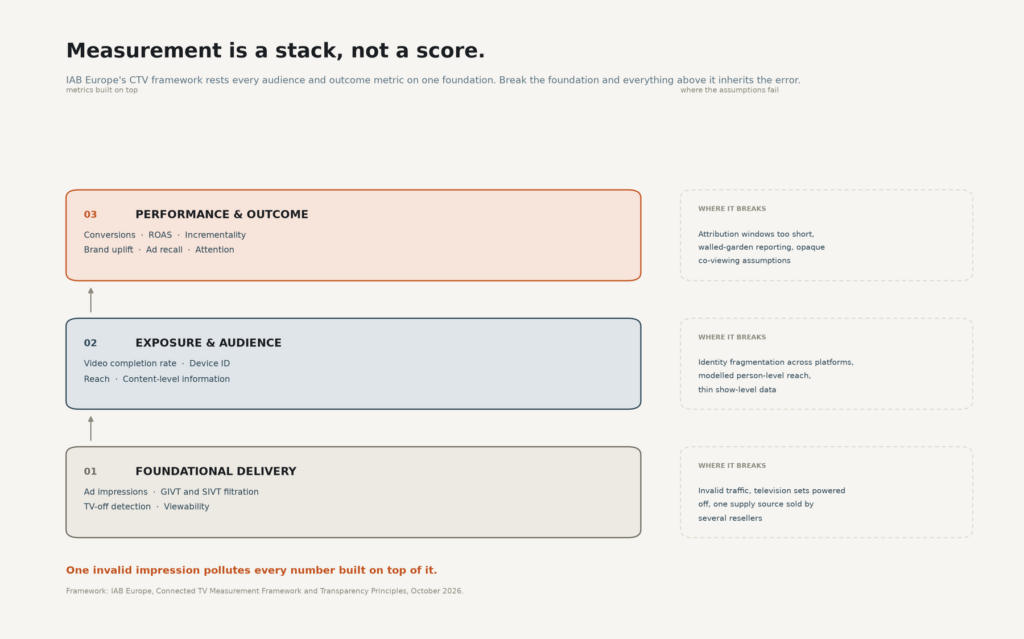
The five accompanying principles are the part buyers should actually read: unified definitions, full disclosure of measurement limitations, support for client-initiated data collection, visibility into device power state, and granular reporting. Note the third. Client-initiated collection means the buyer’s own tag sees the impression rather than trusting the seller’s log. That is not a technicality. It is a power shift, and it is the one most likely to be quietly negotiated away.
Deduplication became a product
Aquila now has 27 advertisers signed as clients, with Meta, Google, Amazon and TikTok contributing impression-level data at no cost, Comscore handling linear, Samba TV covering streaming, and a Kantar calibration panel running past 1,000 homes toward 5,000. Its CEO has estimated that cutting frequency waste by 10 percent could save the industry up to $50 billion over three years. One beta participant, Uber, discovered it was reaching a wider audience than planned at less than half the planned frequency — a finding that would have been invisible in any single platform’s report.
The direction of travel matters more than any single vendor: frequency management is moving from the post-campaign report to the pre-bid decision. That is the difference between auditing waste and preventing it.
Measure the outcome and skip the argument
The currency debate cannot be settled fast enough to answer a client’s question, so a growing number of advertisers have simply changed the question. Amazon Ads and Attain connected streaming exposures for 17 quick-service restaurant brands across 30-plus campaigns to verified purchases — including in-store, drive-through, and cash. The results: $1.74 incremental ROAS, 25 percent above category benchmarks, and $2.08 for campaigns spread across multiple streaming environments versus $1.17 for single-property buys.
You can argue about whether an impression was valid. You cannot argue with a receipt.
Attention as the tiebreaker
In November 2025 the IAB and MRC finalised the industry’s first Attention Measurement Guidelines, giving buyers a common vocabulary for a metric vendors had defined privately for years. Lumen’s eye-tracking work finds 80 to 90 percent of ads on a television screen are noticed, and a 30-second CTV spot earns roughly 16 to 17 attentive seconds against 2 to 3 seconds for a noticed mobile ad.
The more consequential finding came from a Lumen, Amazon Ads and Cint study across 270 campaigns: cumulative attention predicted brand lift eight times more strongly than frequency did. It also identified thresholds — 21 seconds of cumulative attention for awareness, 47 for purchase intent — that no single ad can deliver alone. Same frequency, wildly different outcomes: two campaigns with five exposures each produced 8.9 seconds and 70.5 seconds of attention respectively.
Two impressions counted identically are not remotely equivalent. Attention is the first metric that makes that difference visible inside a media mix model rather than in a footnote.
The honest caveats
Walled gardens will not fully open
Cross-platform measurement is improving at the edges while the centre stays closed. The biggest streamers have no commercial reason to hand over impression-level data, and every iteration of industry cooperation will stop short of that line.
The transition will look worse before it looks better
Two certified currencies, a legacy panel, a new advertiser-owned utility, and your agency’s proprietary model will all disagree for a while. Plan for reconciliation work, not reconciliation.
Over-targeting quietly destroys the premium
CTV’s addressability is a temptation. But television is a brand channel that earns its price through reach and shared attention. Narrow it to the people most likely to convert this week and you have bought an expensive, slow, worse-performing version of search.
Frequency waste persists wherever reporting is siloed
Until identity resolves across surfaces, someone is paying for the same household several times over. The only defence available today is buying through a single point of frequency control and insisting on household-level reporting, not platform-level.
What to do on Monday
Four things, none of them glamorous.
Buy through one point of frequency control. Whatever stack you use, the cap has to live where it can see every surface. Publisher-level caps are decoration.
Ask for the methodology, not the metric. When a seller quotes person-level reach, ask whether it is observed or modelled, and what co-viewing assumption sits underneath. The IAB Europe principles give you the exact questions.
Pay for verification and treat it as media cost. Twenty-five percent invalid traffic in open auction is not a rounding error on a line item; it is a quarter of your budget. Direct deals and verified platforms cost more per impression and less per real one.
Measure one outcome properly instead of five outcomes badly. Pick the business result, run a control, and accept a smaller, cleaner number over a large, unfalsifiable one.
The takeaway
CTV is where television’s audience and television’s budget have gone. What it has not yet inherited is television’s shared arithmetic — and that absence is costing real money every quarter, most of it invisibly.
The opportunity is not in waiting for a perfect currency. It is in buying with the discipline the channel already supports: one point of frequency control, verification treated as cost of goods, and a single honest outcome measured against a control. Advertisers who do that now are already ahead of the ones still waiting for the dashboard that will never arrive.