INSIGHT — The Arithmetic Behind CTV Frequency: Why Four Perfect Caps Add Up to Twelve
There is a particular kind of meeting that happens in every agency that buys connected TV, and it always starts the same way.
The client has seen the campaign report. Average frequency: 4.6. Four and a half exposures per household, right in the comfort zone. Then someone in the room mentions that a colleague saw the same ad four times in one evening across two different streaming apps, and the conversation stops being about the report.
This is not a reporting error. It is arithmetic that nobody signed off on.
The cap is a promise made on one surface only
Here is the mechanic, stripped of vendor language.
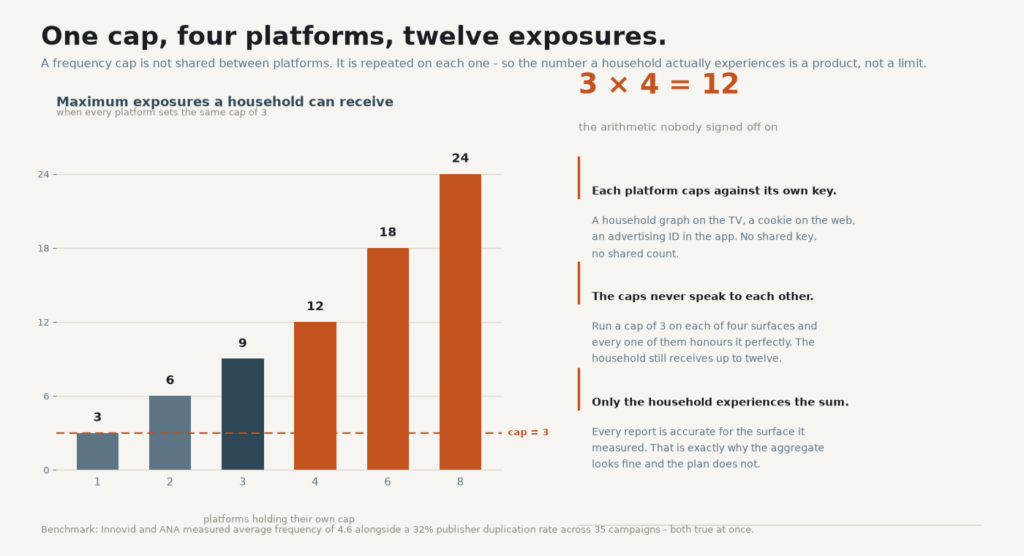
When you buy CTV programmatically, you set a frequency cap. Three exposures per household, say, over a four-week flight. It looks like a single instruction, because it appears in a single line of a media plan. It is not. It is repeated once for every platform that serves the campaign, and each of those platforms enforces it against a key it happens to hold: a household graph on the television, a cookie on desktop, an advertising ID in an app, an IP-derived cluster in a smaller ad server.
Four surfaces, one cap of three, twelve possible exposures. Every individual platform did its job. None of them broke the rule. The rule, as written, could not be broken because it was never one rule to begin with.
The reason this survives so long undetected is that the reports are all accurate. Each platform reports frequency against its own denominator and lands near three. Everything reconciles. It is only when you resolve the household across surfaces that the twelve appears, and by then the flight is over.
Why this explains two numbers that look contradictory
In 2021, Innovid and the ANA studied 35 campaigns from 20 advertisers and found something the industry found hard to believe: average frequency was 4.6, and 85 percent of households saw the ad once or twice. Their conclusion was that CTV’s frequency panic was overblown.
Inside the same dataset they found a 32 percent publisher duplication rate and unique reach that topped out at 13 percent of addressable CTV households.
Sit with those together for a moment, because the pairing is the whole story. Low frequency, low reach, high duplication. That combination is not a paradox; it is the signature of caps enforced separately. Households that happened to be addressable on one platform got counted and capped there. Households spread across several got hit on each, and nothing in the reporting ever added the hits up, because nothing in the stack shared a key.
That is also why the two most-quoted numbers about CTV waste do not conflict. A duplication estimate of roughly 10 percent of media efficiency and an average frequency of 4.6 describe the same system from different heights.
The incentive that keeps it in place
If the arithmetic is this simple, why has nobody fixed it in five years?
Follow the incentive. A frequency cap that spans platforms requires an identity layer that sits above the platforms. Whoever owns that layer owns the count, and whoever owns the count owns the budget conversation. Platforms have a clear reason to keep their household graphs proprietary; agencies have a reason to keep the reconciliation inside their own planning tools; measurement vendors have a reason to sell the missing join as a product rather than a standard.
None of these are conspiracies. They are ordinary commercial positions, and they happen to point in the same direction: the cap stays on the surface, and the arithmetic stays in the household.
The absence of a shared key is not a technical failure that waits for the right engineer to arrive. It is a negotiated outcome that nobody has had a strong enough reason to reopen.
What actually changed
The interesting shift in the last two years is not that someone solved identity. It is that frequency management moved to the moment before the bid rather than the report after the fact.
That distinction sounds administrative. It is decisive. A post-campaign reconciliation tells you that a household received twelve exposures. A pre-bid frequency signal tells the DSP that the household has already been reached on another platform, so the bid does not happen. The first is an audit; the second is a control.
This is the same reason advertiser-owned measurement utilities matter more than they sound. When the count is assembled by the buyer rather than reassembled from seller logs, someone in the room can answer the client’s question with a number instead of a caveat.
The part I would keep
Strip away the vendor narratives and one sentence survives: every party in the chain is optimising the number it can see, and no party’s number is the household’s number.
That is worth holding onto because it predicts the failure mode before you encounter it. When a plan promises a household frequency of three, ask which surfaces are sharing the key that enforces it. If the answer is “each one sets it,” you have not bought a cap. You have bought four caps and a multiplication table.