Why Western Dashboards Keep Missing the Metric China Runs On
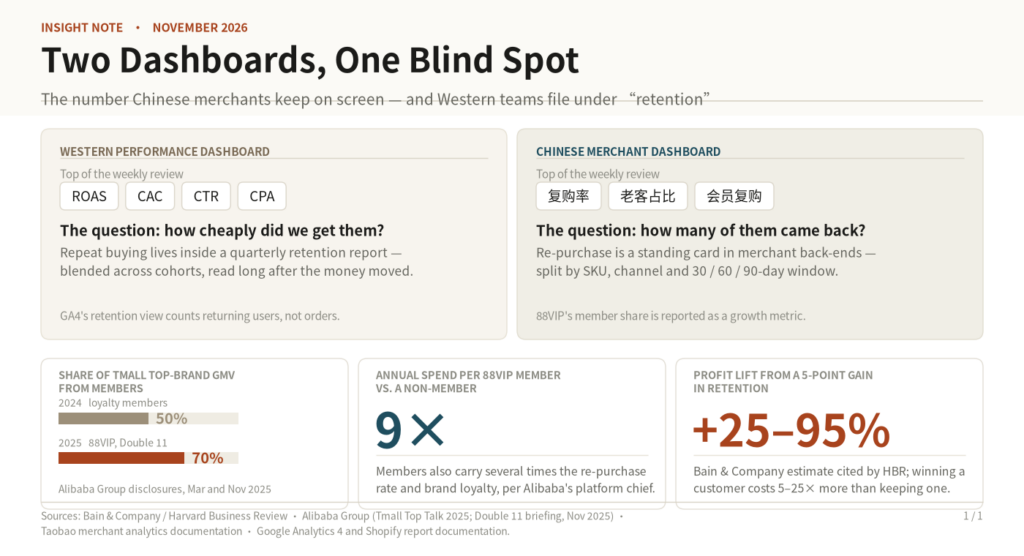
Ask a Western performance marketer what number runs their week and you will hear ROAS, CAC, CPA. Ask a Chinese merchant the same question and the answer is increasingly 复购率 — re-purchase rate. Not a footnote in a quarterly retention deck. A standing card in the merchant back end, opened on a Tuesday.
That difference looks like taste. It is actually instrumentation — and instrumentation decides what gets funded.
Why the number never surfaces in the West
Western analytics stacks were built to count sessions, not relationships. GA4’s retention reporting tracks returning users, not repeat orders; a customer who buys three times in one visit and one who returns in month four can look much the same. Shopify’s default returning-customer rate is order-based and blends cohorts, so a 2019 buyer still moves a 2026 number.
When no clean cohort-window repeat figure exists in the default stack, the question migrates to the only place that can answer it: the quarterly retention report. By then the money is spent, and the answer is historical.
Chinese merchant back ends ship the opposite default. Tmall’s customer-operations console defines re-purchase rate as members who bought in period A and again in period B, divided by members who bought in A — 90-day member re-purchase is the worked example, refreshed monthly. The window is part of the metric. Nobody has to build it.
What a standing metric does to a budget
Attention follows the dashboard. Alibaba reported in early 2025 that loyalty members contributed over half of sales at its top Tmall brands. By the 2025 Double 11 window, 53 million 88VIP members accounted for more than 70% of top-brand GMV, with per-capita annual spend nine times that of non-members and a re-purchase rate several times higher.
You do not need a strategy memo to act on that. You need a card on a screen you already open.
The economics are not in dispute. Bain’s long-running estimate holds that a five-point gain in retention lifts profit by 25% to 95%, and that winning a customer costs five to twenty-five times more than keeping one. McKinsey has a name for the failure mode — the acquisition trap.
The shift is now showing up in how Chinese brands talk about peak season. Coverage of the 2026 618 festival found brands replacing GMV-only scorecards with re-purchase rate, member contribution and retention — precisely the numbers a re-purchase-first dashboard makes visible.
Where the argument breaks
Re-purchase rate is category-bound. Consumables and pet food cycle in weeks; furniture does not. A blended all-time figure flatters almost every store, because it pools stable cohorts with decaying ones. The Chinese console sidesteps this by fixing a window. Most Western stores never pick one, then conclude the metric is unreliable.
The fix is small and unglamorous: identify your natural re-purchase cycle, multiply by 1.5, and track the second-order rate for each first-purchase cohort at that horizon — weekly, not quarterly. Then set it beside CAC rather than beneath it.
The gap was never analytical. It was architectural. Architecture, unlike habit, is editable.