Why Martech Utilization Never Actually Recovered
Every year the industry publishes the same number in a slightly different costume, and every year the audience nods at it.
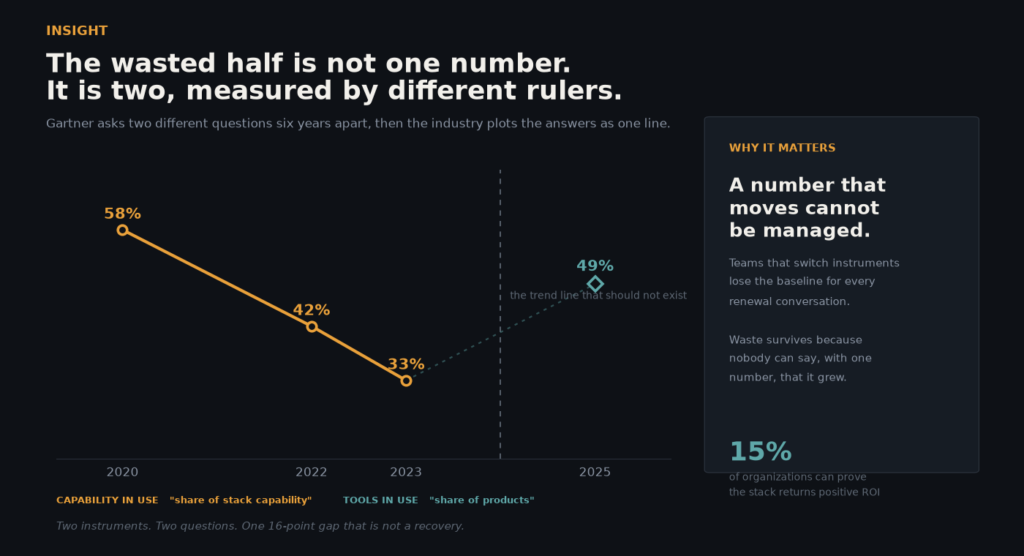
In 2022, Gartner asked 324 marketers what share of their stack’s capabilities they used: 42%, down from 58% in 2020. In 2025 it reported that 49% of martech tools were actively used, and framed it as utilization having “dropped to 49%.” Read those as one trend and teams clawed back 16 points in two years.
They did not. The first counts features actually touched; the second counts tools actually opened. A team can use seven of eight tools while touching a third of their features, and both figures are true at once. The 16-point rise is an artifact of the ruler, not the behavior.
That matters beyond pedantry. Waste can only be managed against a stable baseline, and this one is swapped at the exact moment somebody might have to defend it.
The three causes were self-inflicted
Gartner named the mechanism in 2022, and the list is more damning than the percentage: overlap among martech solutions (30% of respondents), difficulty recruiting talent to drive adoption (28%), and ecosystem complexity and sprawl (27%).
None is a technology failure. Overlap, talent scarcity and sprawl are not caused by tools being bad at their jobs, but by there being too many of them. Every purchase adds capability and simultaneously adds overlap, training burden and integration surface. The stack degrades because the portfolio is too large to be learned by the people who must operate it.
So the cure was always subtraction, and subtraction has no vendor, no demo and no quota. Nobody’s commission depends on a deal you did not sign. A vendor is paid to argue overlap is synergy, a new hire wants the tool they already know, and a manager is promoted for launching a platform, not cancelling one. Buying is a career event with a launch date. Cancelling is admin with no photo opportunity.
Why the money survived the cuts
The strangest part is that the waste outlasted the budget.
Martech’s share of the marketing budget fell from 26.6% in 2021 to 19.4% in 2026, the lowest level in a decade, per Gartner’s 2026 CMO Spend Survey, while 56% of CMOs say they lack budget to execute their strategy. Under that pressure you would expect dormant subscriptions to be the first casualties.
They were not, because the cost never appears where the decision was made. It sits on departmental cards, folded into unaudited seat counts, and increasingly billed per token. A per-seat duplicate is an obvious line item; a consumption-based duplicate is a variable cost nobody can attribute. Zylo’s 2026 index puts license utilization at 54%, so 46% of paid seats go unused.
The measurement problem compounds. Gartner counts features, then tools. Zylo counts licenses across 305 applications at large enterprises. BetterCloud counts 118 applications across a broader market, 27 AI-powered, 44% unsanctioned by IT. Three credible firms, three denominators, none comparable. No CMO can defend a baseline nobody else measures the same way.
So why does the wasted half persist? Not ignorance. Everyone knows. It persists because the people who gain from each subscription and those who absorb its cost are never the same person, and because the number that would expose the gap gets redefined about as often as the gap gets closed.