Why China’s Growth Numbers Keep Disagreeing
One books revenue. The other books volume. In 2026, they stopped agreeing.
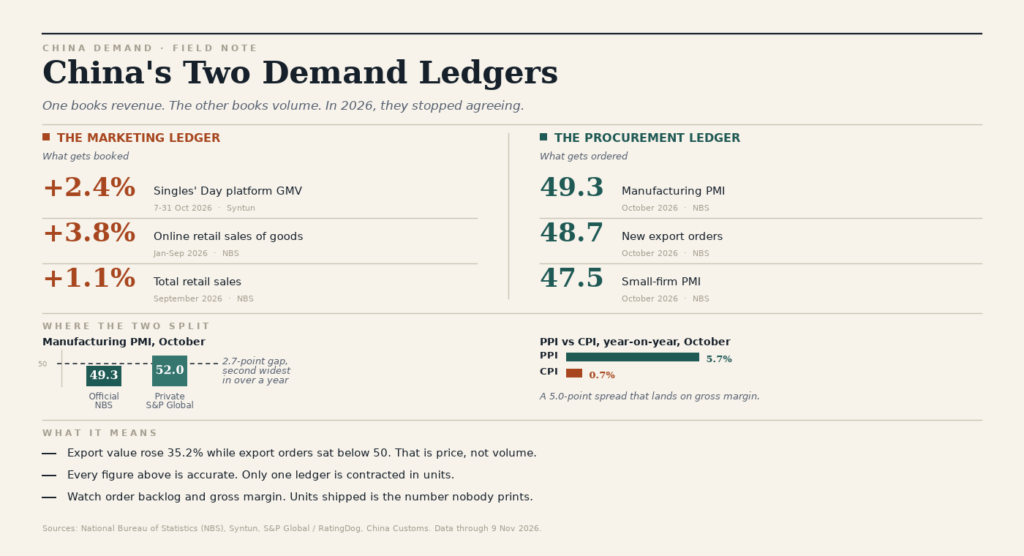
China’s October data handed marketers two readings of the same economy, published within nine days of each other. Consumer prices rose 0.7% year on year. Producer prices rose 5.7%, the fastest factory-gate inflation since June 2022. Retail sales grew 1.1%. Manufacturing PMI slipped to 49.3, with new export orders at 48.7. And exports rose 35.2% in value.
None of those numbers is wrong. They simply aren’t denominated in the same unit. One ledger counts yuan. The other counts orders, and direction.
What Each Ledger Actually Measures
The marketing ledger is a revenue ledger. Syntun counted 1.0263 trillion yuan of platform sales between 7 and 31 October, up 2.4% year on year. For context, last year’s full promotional window grew 14.2%, and the year before that, 26.6%. The growth rate has compressed by roughly a factor of six while the base got larger. Retail tells the same story once you deflate it: 1.1% nominal growth minus 0.7% consumer inflation leaves something close to 0.4% real, and car sales fell 21.2%.
Why the Gap Opens
Price first. Everything above is nominal. A yuan of GMV in 2026 buys less real activity than a yuan did in 2024, and no platform dashboard applies the deflator for you.
Then sample. The official PMI surveys 3,200 manufacturers weighted toward large firms, which printed 50.2. Small firms printed 47.5. S&P Global’s RatingDog panel of around 650 companies leans private and export-facing, and came in at 52.0. Same month, same factories, 2.7 points apart — the second-widest split in over a year.
Then the subsidy stack. A listed price is now the first of five layers: platform instant discount, store voucher, payment-instrument rebate, instalment financing, government trade-in subsidy. GMV tends to book near the top of that stack. Cost gets booked at the bottom.
The Number Nobody Prints
Here’s the tell. Consumer-goods prices at the factory gate fell 0.1% year on year in October, even as input costs climbed. Order backlogs dropped to 44.1. Analysts at Raiffeisen Research noted that much of the export surge came from prices rather than volumes. Every figure is accurate, and only one ledger is contracted in units.
What to Do With It
- Ask for units. Volume, not value, is the honest denominator. If a supplier can’t give you units shipped, you’re reading a price series.
- Watch gross margin, not revenue. Margin is where the PPI–CPI spread actually lands.
- Treat backlog as your leading indicator. It turns before GMV does.
Two ledgers, two truths. The truth is in the gap — and the gap is measured in things, not yuan.