Same Cheque, Different Voice: The Signal China’s Ad Rankings Bury
On the ratio nobody publishes — and why it decides who is actually ahead.
In August 2026, QuestMobile put China’s internet ad market at ¥385.3 billion for the first half of the year, up 7.1% year on year. Every write-up led with those two figures, and for once the headlines weren’t wrong. They were just answering a question nobody in a budget meeting is actually asking.
Here’s the question they are asking: are we winning?
The denominator is the whole argument
Nielsen defines share of voice as a brand’s media spend expressed as a percentage of all media expenditure in the category, in that market, on that channel, at that moment. Read that definition slowly, because the operative word sits in the middle. Category.
Your customer is not choosing between you and the entire ¥385.3 billion. She is choosing between you and the four or five brands that happened to be on her shortlist. Those rivals are your real competitive set, and their combined spend is your real denominator. Benchmarked against the whole market, a ¥1 billion budget looks like a rounding error. Benchmarked against the room you actually compete in, it can be the loudest thing there.
What the H1 split quietly reveals
Beauty and personal care took 33.7% of hard-ad budgets in H1 2026. That puts its pool near ¥129.9 billion — an expensive room to shout in. Meanwhile mobility and travel grew 57.0%, healthcare 35.1%, IT and electronics 29.2%. Small pools, moving fast. Sports and outdoor fell 9.6%, online shopping 1.6%. Crowded rooms, emptying out.
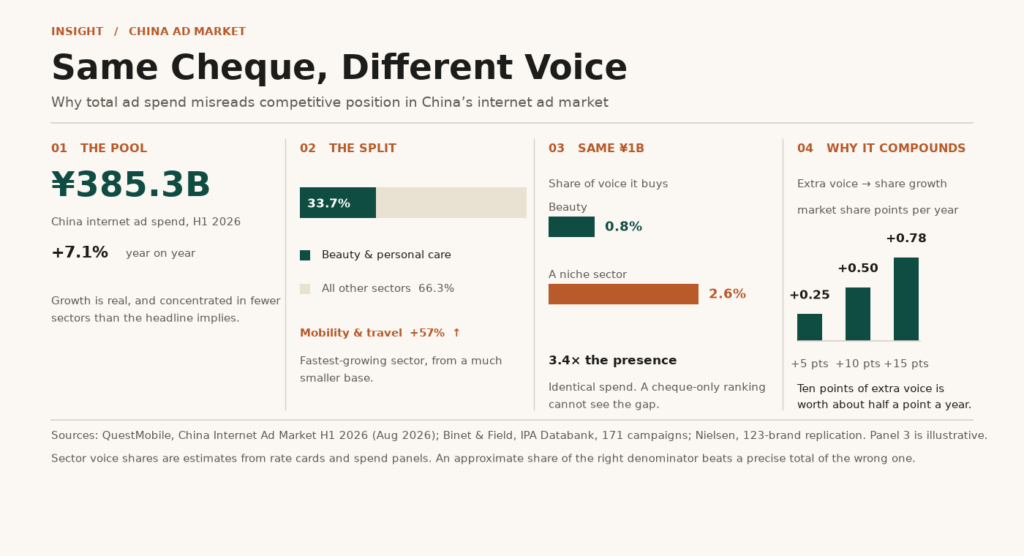
Now do the arithmetic. ¥1 billion spent inside beauty buys roughly 0.8% of that sector’s voice. The same ¥1 billion spent in a sector worth a tenth of the total market buys 2.6%. Identical money, 3.4 times the presence. A leaderboard sorted by cheque size registers no difference at all between these two advertisers — which is precisely why the leaderboard misleads.
Why the gap compounds, not the level
Binet and Field analysed 171 campaigns from the IPA Databank spanning 1980 to 2010 and found that 10 percentage points of excess share of voice corresponds to roughly 0.5 points of market-share growth per year. Nielsen replicated it across 123 brands and landed in the same place. The metric that does the work is the subtraction: share of voice minus share of market. Not how much you spend. How far ahead of your own size you spend.
Run that subtraction by sector and the ranking inverts. A mid-sized advertiser holding 30% of voice in a ¥20 billion niche is carrying a healthy surplus. A giant holding 12% of voice in a ¥130 billion category, against 18% share of market, is running a deficit — and still sits higher on the table.
The habit worth building
Take the published totals and re-sort them by industry. Two columns are enough: spend, and spend as a share of the sector pool. Then set your own market share beside the second column. Where the gap is negative and widening, you have a warning that surfaces in voice quarters before it surfaces in sales.
Where this breaks
Binet and Field are candid that sector responsiveness modifies the relationship, and that adding share gets harder as a brand gets bigger. A dominant niche voice is a lead indicator, not a promise. Sector pools are estimates assembled from rate cards and spend panels, and they carry real error. But an approximate share of the right denominator still beats a precise total of the wrong one — and this year, in the most expensive ad market in Asia, that trade is worth making.