Two Mobile Ad Curves: The Story the Numbers Tell
China went mobile before it had a desktop internet worth skipping. The West built the desktop first, then moved. Ten years on, one curve is still climbing and the other peaked in 2020 and quietly rolled over. But the gap between them isn’t the gap you think.
1. The two curves, and why the totals lie
Overlay a decade of mobile ad-spend data — China on top of the United States — and you get two lines that look like a horse race. One broke early and steep. The other laboured, caught up, then did something stranger: it peaked, and went sideways.
Most commentary stops there and declares a winner. That’s the least interesting reading available.
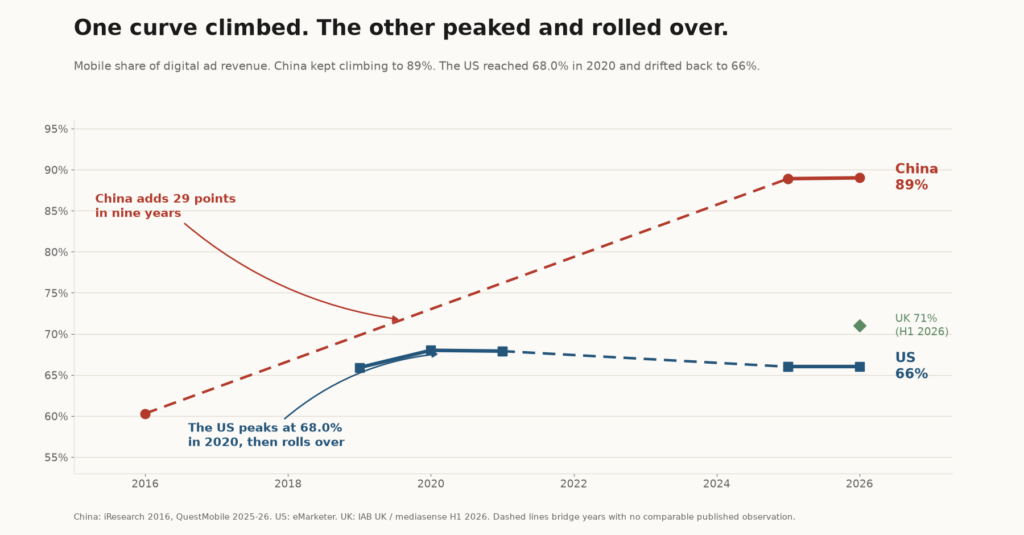
Here’s what the curves actually say. China’s mobile share of internet ad revenue went from 60.3% in 2016 to 88.9% in the first half of 2025, and sits near nine in ten today. The United States got to 68.0% in 2020 — and then stopped. Not slowed. Stopped. It has drifted back to roughly two-thirds and stayed there, and eMarketer’s March 2026 forecast still has it at two-thirds. The UK, the cleanest comparable series in Europe, held at 71% in the first half of 2026, exactly where it was a year earlier.
Read those three facts together and a question writes itself: why does one mature market keep climbing while two others flatline?
Because a share curve that stops moving is telling you the migration is finished. And a market where the migration is finished has to find growth somewhere else entirely.
2. What we measured, and what we refused to measure
Let me be straight about the yardstick, because this is exactly the story that gets told wrong.
There is no “Western” series. No single, consistent US-plus-UK-plus-EU mobile ad-spend number exists. Anyone who hands you one has blended definitions that don’t reconcile — different treatments of in-app, of classifieds, of retail media. So I use the United States as the primary proxy, since it has the longest published series and the tightest reporting regime, and the UK as independent corroboration wherever its IAB publishes a device split. Where the two agree, I trust the shape. Where they diverge, I say so.
China’s two statistics don’t measure the same thing. The State Administration for Market Regulation counts advertising business revenue — money flowing into ad firms. QuestMobile counts money spent on media. Those are different flows moving at different rates, and anyone who swaps one for the other mid-argument will produce nonsense. I use the regulator for the money-supply side and QuestMobile for the device split.
One entire category of numbers got thrown out. Several Chinese research vendors publish a “China mobile advertising market size” in RMB, and they disagree violently: ¥486.8 billion, ¥1.1 trillion, ¥1.58 trillion. A three-fold spread isn’t rounding. It’s a disagreement about what’s being counted, and any number I can’t reconcile would poison everything downstream. Dropped, all of it.
One ratio carries a warning label. China’s 2026 figure is an eMarketer forecast; the US figure is an IAB actual. Different bases, so the ratio I quote later is indicative, not precise. I’d rather say that out loud than pretend the two numbers are commensurable.
3. Reading curve one: the leapfrog
3.1 China went mobile before it had a desktop to skip
China’s curve isn’t steep because Chinese consumers loved phones more. It’s steep because there was far less desktop to displace.
By 2015, mobile was already 22.3% of China’s total media ad spend — the highest mobile share of any market on earth, per eMarketer, with mobile ad spend doubling that year to $15.82 billion. Mobile overtook PC-based internet advertising in China during 2015. In 2016 the gap became an avalanche: mobile ad spend hit ¥175.0 billion, up 75.4%, for 60.3% of the entire online ad market, while PC spend actually fell 2.9% — its first decline ever, per iResearch.
That’s not a market choosing a device. That’s a market that never really built the alternative.
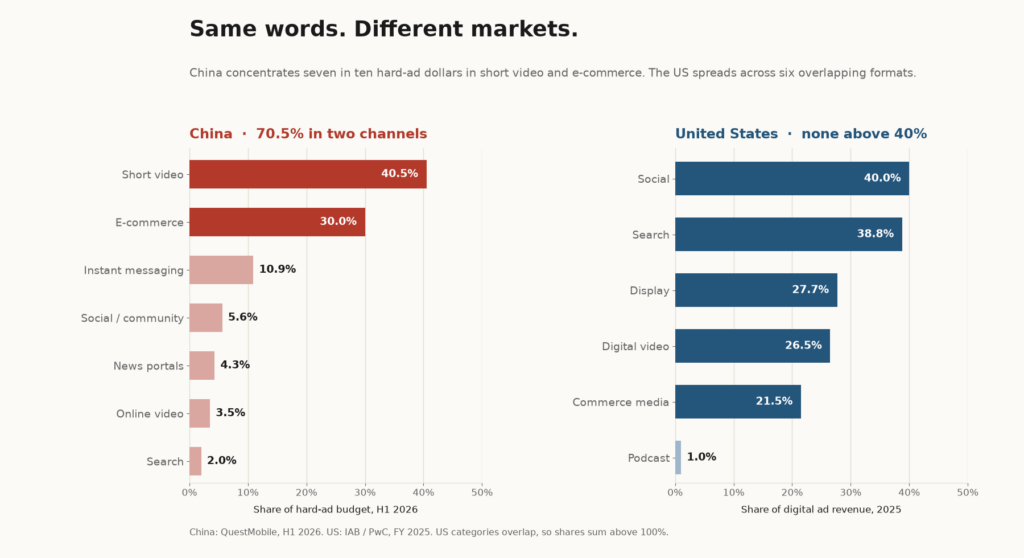
And the concentration followed the device. Look at what China’s hard-advertising budget bought in the first half of 2026: short video took 40.5%, e-commerce platforms 30.0%. That’s 70.5% in two channels. Instant messaging took 10.9%, community and social 5.6%, news portals 4.3%, online video 3.5%, and search — search — 2.0%.
Only two of those seven channels gained share. Short video added 3.2 points, e-commerce 0.9. Everything else was squeezed. Search at 2% of hard-ad budget should stop you cold, because search is the channel that anchors the entire Western lower funnel.
3.2 The West climbed, then stopped climbing
The US curve tells a different story, and its flatness is the whole point.
US mobile went from 65.9% of digital spend in 2019 to 68.0% in 2020, dipped to 67.9% in 2021, and has sat near 66% since. Why? Because the money didn’t run out of mobile — it ran sideways. Connected TV became a real budget line, at $37.95 billion in 2026 on eMarketer’s forecast, up about 15%. Retail media graduated into its own P&L, from $58.79 billion in 2025 to $69.33 billion in 2026. Commerce media grew 18% to $63.4 billion in 2025 on the IAB’s count.
Add those to desktop, audio and digital out-of-home and you get a market where mobile is the biggest slice of a pie that keeps sprouting new slices. Mobile’s share plateaus not because mobile lost, but because adjacent categories grew faster than the numerator could.
That’s structural, not a matter of timing. China’s ad market has no meaningful CTV line. It has no retail-media category sitting outside the e-commerce platforms — retail media is the e-commerce platforms, which is why eMarketer puts retail media at 44.0% of China’s total ad spend in 2026, against 9.4% in Japan.
One curve is a market concentrating. The other is a market diversifying. Plot them on the same axes and you’ll misread both.
4. Reading curve two: share as a proxy for integration
89% is not a victory lap
It’s tempting to read China’s 89% as proof of mobile superiority. Resist it. Read it as a measurement of integration.
When 88.9% of a market’s internet ad revenue arrives through a phone — QuestMobile’s figure for H1 2025, with OTT and smart hardware at 9% and PC at 2.1% — you aren’t looking at device preference. You’re looking at an ecosystem where discovery, conversation, payment and checkout happen inside one app session. No handoff. No second screen in the funnel.
The West’s 66% measures the opposite. Not less digital — the US is at roughly 82% digital share of total media spend against China’s 86.1%, four points apart. Less integrated. The US funnel runs search on one surface, social on another, purchase on a third, telemetry across all three and none of them cleanly. A mobile plateau at two-thirds is the numeric fingerprint of that fragmentation.
So here’s the reframe worth carrying into a budget meeting: mobile share is a proxy for friction, not for modernity. High share means the distance from ad to transaction is short. Low share means it’s long — and that the intermediaries bridging it are taking a cut.
5. The composition split
Now the part the totals hide completely.
5.1 China’s mobile dollar is a transaction
China’s internet ad market reached ¥385.34 billion in H1 2026, up 7.1%, with the second quarter up 8.1% on the back of the 618 shopping festival. Growth was concentrated, and the concentration was transactional.
Ten platforms took effectively the whole market: Taobao at 22.8% of hard-ad share, Douyin 18.7%, ByteDance’s Qianchuan 14.6%, WeChat 10.7%, Kuaishou 6.8%, Xiaohongshu 5.4%, JD 5.0%. Read those names again. Nine of the ten are places where you can complete a purchase without leaving.
That’s what a mobile ad dollar buys in China: proximity to checkout. eMarketer’s retail-media number — 44.0% of total ad spend — is the same fact stated differently. China’s retail media investment hit $75.85 billion in 2025, larger than the US at $60.81 billion, inside a total ad market that is smaller. Nearly half of all Chinese ad money changes hands inside a transaction environment.
5.2 The West’s mobile dollar is a decision
Now the US, 2025 actuals from the IAB and PwC: total digital ad revenue $294.6 billion, up 13.9% — and remember, 2025 had no Olympics, no World Cup, no election. Social at $117.7 billion and 40.0% share, growing 32.6%. Search at $114.2 billion and 38.8%, growing 11%, its slowest in years. Digital video $78 billion, up 25.4%. Commerce media $63.4 billion, up 18%. Display $81.6 billion, up 9.8%. Creator advertising graduated into a genuine channel at $37 billion.
No single category exceeds 40%. The categories overlap by construction, so they sum past 100% — a reminder that this is a market of layered formats, not stacked channels.
The composition reads as a market organised around persuasion and discovery, with commerce arriving late and from the side. Commerce media’s 21.5% of US digital revenue is the fastest-improving line in the table, and still under half of China’s 44% — though the denominators differ: 44% is of China’s total ad spend, 21.5% is of US digital ad revenue. The direction is reliable. The exact multiple isn’t.
The sentence I’d underline: in China, mobile advertising is mostly a transaction layer. In the West, it’s mostly a decision layer. Same line item on a media plan. Entirely different job.
6. The per-user correction
The outline this piece grew from made a claim I have to retract: that normalising for population narrows the China–West gap.
It doesn’t. It exposes what the gap actually is.
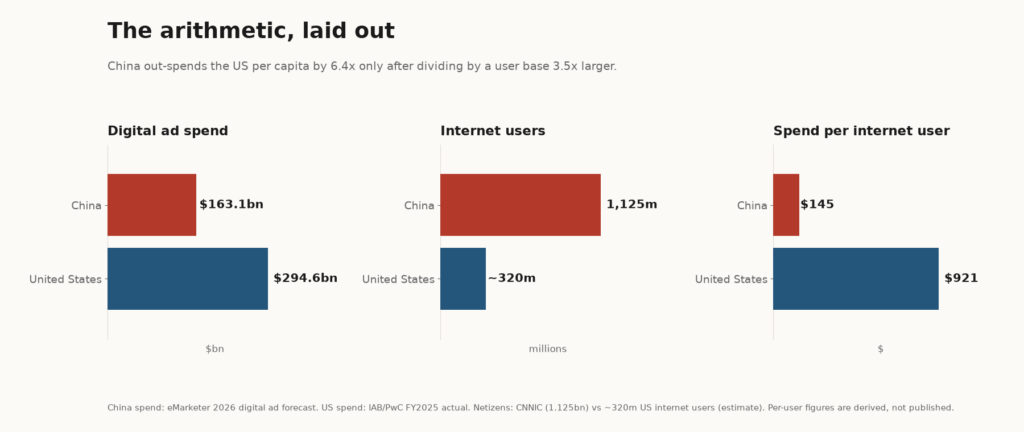
Run the numbers. China’s digital ad spend of $163.1 billion against CNNIC’s 1.125 billion netizens — the 57th statistical report, published February 2026 — gives about $145 per user. The US, at $294.6 billion and roughly 320 million internet users, comes out near $921. That’s a ratio of about 6.4 to 1.
So China out-spends the US in total digital advertising, and simultaneously monetises each user at roughly a sixth of the US rate. Both statements are true. The first is a population effect. The second is the interesting one.
If per-user monetisation is still sitting at that level after a decade of the fastest mobile build-out in history, the ceiling on China’s ad market is set by consumer spending power and ad-load tolerance — not by technology. And ad load is visibly binding: Douyin’s information-flow ad load sits around 15%, while WeChat Channels is still at 3–5%. There’s inventory left in one product and very little in the other. Growth from here has to come from yield per impression, not from more impressions.
7. Where the headroom actually is
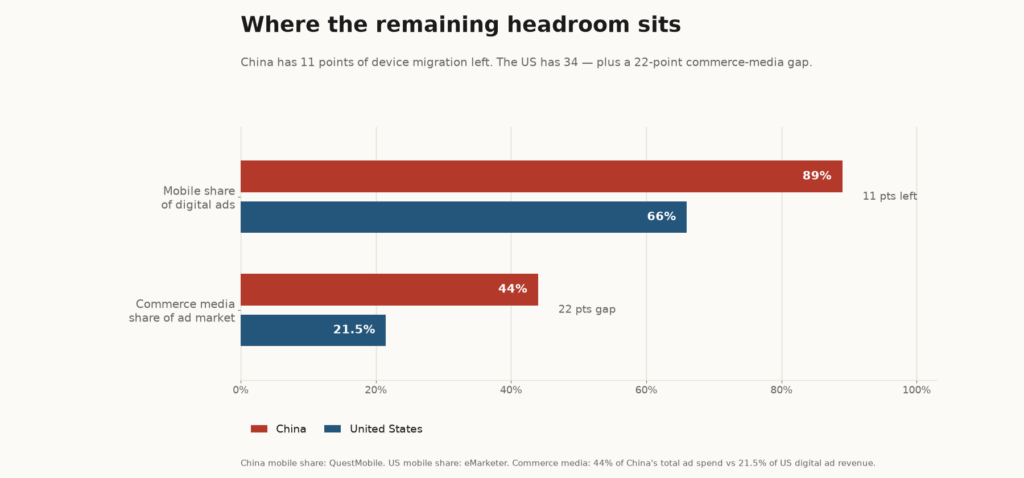
Put the two markets side by side on the two dimensions that matter and the forecast almost writes itself.
Device mix. China is at 89%. Call the practical ceiling 100%, though it never quite arrives — OTT and smart hardware will keep a slice. Eleven points left, and the last few are the hardest. The US is at 66%. Thirty-four points of runway, though a chunk of that gets absorbed by CTV rather than mobile, because that’s where incremental viewing hours are going. eMarketer expects mobile video ad spend to overtake mobile search in 2026 — the mix is shifting inside mobile, too.
Budget composition. China’s commerce-inside-advertising share is 44%. US commerce media is 21.5% of digital revenue. Twenty-two points of structural gap.
Which is why the two forward stories look nothing alike. China has to grow by making each impression worth more. The supply-side migration that fuelled the last decade is essentially done, and the regulator’s own numbers show the shape of it: internet ad business revenue jumped 34.6% in 2025 to ¥1,357.43 billion, but across the first three quarters of 2026 the mobile publishing line grew 14% — healthy, no longer explosive. Maturity, arriving on schedule.
The US has to grow by importing China’s composition. Commerce media, retail networks extending off their own shelves, shoppable video, agentic buying. eMarketer’s 2026 headline — Meta’s net ad revenue at $243.46 billion edging past Google’s $239.54 billion, with Meta growing 24.1% against Google’s 11.9% — read structurally, is the sound of a social-and-commerce surface overtaking a search surface. That’s not a story about AI cleverness. It’s a story about where the transaction lives.
8. Three things that would break this story
Forecasts deserve stress tests. Here are mine.
China’s ad-load ceiling could move. If WeChat Channels pushes from 3–5% toward 10%, one product adds inventory on a scale that resets the curve. Watch that number, not the aggregate.
The Western plateau could break upward. If retail media networks keep selling inventory across the open web, commerce media could compress the structural gap faster than any model shows. Dentsu has retail media growing 12.3% globally in 2026 against digital’s 6.7%; eMarketer’s December view had 14.1%. Hold that pace three years and 22 points closes meaningfully.
A definitional break. China’s rules on AI-generated ad labelling and user opt-out rights, in force since 2025, raise compliance cost and can shift measured spend between categories without any change in behaviour. Treat any single-year compositional jump in China with suspicion until a second source confirms it.
9. What to do about it
9.1 If you sell into China
Plan for a mature, high-volume, low-yield-per-user market. Not an infinite-growth one.
Budget the way the composition says to. Short video and e-commerce are 70% of hard-ad budget and the only two channels still gaining share. Search at 2% is a rounding error — don’t build a China plan around it. And plan for efficiency gains rather than reach expansion, because the reach is largely bought and the ad load is near its limit.
Measure conversion inside the platform, because that’s where it happens. The handoff you’re used to measuring doesn’t exist here.
9.2 If you sell into the West
Stop treating the mobile plateau as a ceiling on ambition. It’s a ceiling on migration, and migration was never the interesting part.
The interesting part is that 34 points of device runway remain, commerce media sits at half of China’s share, and CTV is quietly becoming the connective tissue between brand and performance. The brands that win the next four years will treat retail media as a measurement spine rather than a line item, and build for a funnel where the transaction increasingly happens on a surface they don’t own.
Also, expect concentration. The top ten companies took 84.1% of US digital ad revenue in 2025, up from 80.8%. This is not a market that rewards a broad, evenly-spread buy.
The takeaway
Two curves. One born mobile-first, concentrated, transactional, and now visibly maturing against a hard ceiling of consumer spending power. One late to mobile, fragmented across screens, flat at two-thirds — and still holding more transformational headroom than the market that looks like it’s winning.
The numbers that get quoted are the wrong ones. Totals flatter China and understate the West. Per-user figures flatter the West and understate China’s structural integration advantage. Neither is a verdict — they’re two different photographs of the same thing.
Read the slopes and the shares instead. China’s slope is done; its share is a moat. The West’s slope is done; its share is a map of everything it hasn’t integrated yet.
The next decade isn’t convergence. It’s compositional convergence against structural divergence — the West slowly importing China’s transactional logic while keeping its own fragmented plumbing. Plan for the market each curve actually describes, not the one the headline sells you.