AI Customer Insights: Synthetic Data Beats Surveys
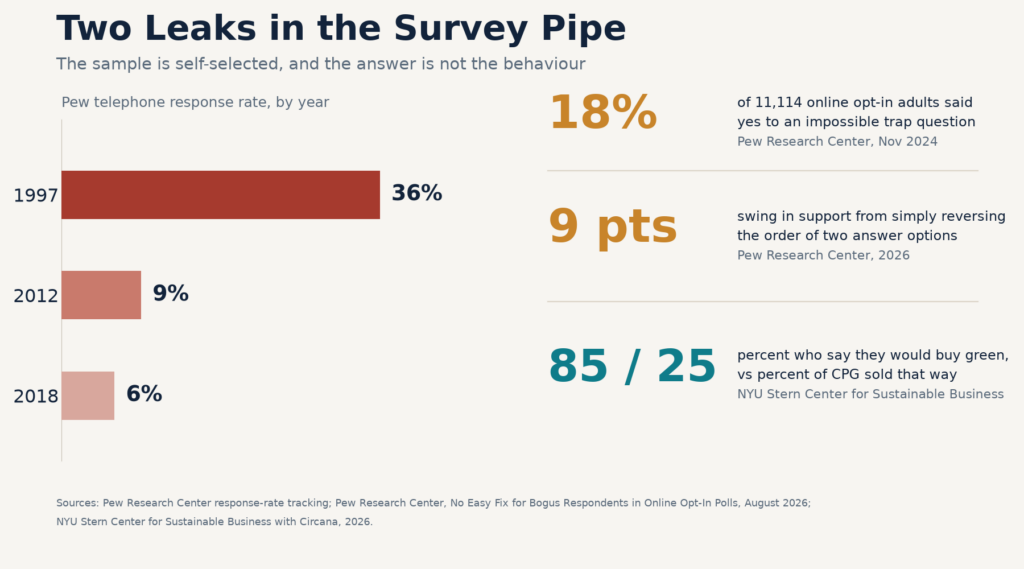
Start with a number that should bother you. In November 2024, Pew Research Center put a questionnaire in front of 11,114 US adults recruited through online opt-in panels. Two items in that questionnaire were traps: a social platform called Fizzypress that does not exist, and a trip to the International Space Station that the respondent had certainly never taken. One in six — 18 percent — said yes to at least one impossible thing. Every one of those people had already cleared their panel supplier’s own quality screen.
That is the raw material sitting underneath a great deal of brand tracking. Not fraud in the criminal sense. Just people clicking a plausible-looking option because clicking is faster than thinking, and because nobody at the other end will ever check.
Now stack a second problem on top of it. Pew’s telephone response rate was 36 percent in 1997, about 9 percent by 2012, and roughly 6 percent by 2018. At six percent, you are not sampling a market. You are sampling the small, specific, self-selected minority of people who still answer unknown numbers — and then weighting them until the crosstabs stop looking embarrassing.
And a third. Ask people whether they would pay more for a sustainable product and 85 percent say yes. Look at what actually sells, and 25 percent of US consumer packaged goods moves that way, according to NYU Stern’s Center for Sustainable Business working with Circana. Sustainability-marketed CPG, incidentally, drove nearly 45 percent of category growth over thirteen years and grew 4.9 times faster than conventional products at a 27 percent average premium. The stated demand was never wrong about direction. It was wrong about magnitude by a factor of three.
So when someone tells you surveys lie, the more precise accusation is this: surveys measure what people are willing to say out loud, to a stranger, about a hypothetical. That is a real thing to measure. It is just not the thing most purchase decisions are made of.
Why the survey broke, in three separate failures
It helps to stop treating this as one problem, because the three failures have three different fixes.
The room keeps getting emptier
Nonresponse is structural, not a fieldwork embarrassment you can budget your way out of. Every callback, every incentive, every clever subject line is fighting a phone that screens unknown callers and a person who gets eleven feedback requests a week. When a well-resourced organisation with a dedicated methods team lands at six percent, your panel is not doing better.
The room is also paying less attention
Pew’s August 2026 study is the useful one here, because it tested the screening tools the industry sells as the answer. Trap questions flagged 18 percent of the sample. An automated prescreener would have failed nearly half of all completes. Matching respondents to a commercial voter file actually increased total error, because it removed valid people who declined to hand over contact details and let some inventive fakes through.
The attention failure shows up in softer places too. Reverse the order of two answer options on a question about undocumented immigrants and support for the harsher option moves nine points. Nothing about the country changed between those two halves of the sample. Only the layout did.
The answer is a performance, not a report
Post-rationalisation is the part marketers underestimate. People do not have a stable preference sitting in a drawer, waiting to be retrieved. They construct one at the moment you ask, using whatever is salient, and then they defend it. Ask about a price and you get a number that sounds principled. Watch the same person at the shelf and you get a different number, because the shelf has a competitor’s label on it and the questionnaire did not.
This is where synthetic respondents enter, and it is worth being precise about what they fix and what they do not.
What a synthetic respondent actually is
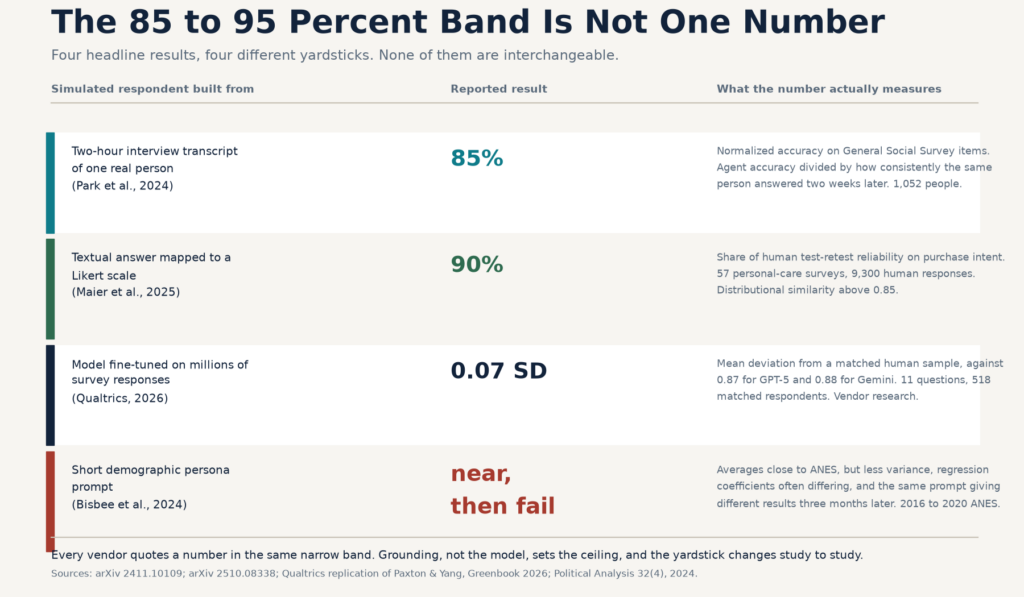
Strip away the vendor language and a synthetic respondent is a language model conditioned to answer as a described person. The description is everything. Four published builds, four very different results.
Give the model a two-hour interview transcript from one real individual and the agent reproduces that person’s General Social Survey answers 85 percent as accurately as the person reproduces their own answers two weeks later. That is Park and colleagues at Stanford and Google DeepMind, working with 1,052 people. Give the same model a short demographic paragraph instead, and the normalised accuracy drops to about 71 percent, with the gap widening along racial and ideological lines. The interview is doing the work, not the model.
Ask the model for free text instead of a number, then map that text onto a rating scale by embedding similarity, and you get 90 percent of human test-retest reliability across 57 personal-care surveys and 9,300 human responses — Maier and colleagues, published in 2025, with distributional similarity above 0.85. The trick matters: models asked to produce a Likert number cluster around the middle and hand you a suspiciously tidy dataset.
Fine-tune a model on millions of survey responses and match it against a human sample and the mean deviation falls to 0.07 standard deviations, against 0.87 for GPT-5 and 0.88 for Gemini on the same eleven questions with 518 matched respondents. That is Qualtrics’ own replication of a published benchmark — vendor research, disclosed as such, and the spread between their tuned model and off-the-shelf models is the finding, not the headline number.
And prompt a general-purpose model with demographic personas, then ask it to rate eleven sociopolitical groups? The averages land near the American National Election Study. Almost nothing else does. Variance is lower than in the real surveys, regression coefficients often differ significantly from the equivalent human estimates, minor prompt rewording shifts the distribution, and the same prompt produced materially different results three months later. Bisbee and colleagues, in Political Analysis.
Four studies, four yardsticks, one band of numbers quoted as if it were a property of the technology. It is not. Grounding is the variable.
Where synthetic genuinely wins
Here is the argument that survives contact with the evidence. Synthetic respondents are not better than surveys at measuring opinion. They are better at something surveys cannot do at all: forcing a trade-off.
The dollar vote beats the poll
A questionnaire asks how important price is on a five-point scale. A conjoint task makes the respondent choose between more memory and a lower price. Those are different cognitive events. When Brand, Israeli and Ngwe ran conjoint tasks through GPT, the average willingness-to-pay estimates came out economically plausible — close enough to a companion human survey to be interesting. The failure appeared one level down, at the segment, and it was severe: for buyers earning under $50,000, humans valued extra laptop RAM at $17.80 while the model priced it at minus $4.40, meaning this group would pay to avoid memory. Asked to choose among laptops with a none-of-these option, the simulated low-income buyer refused all options 95 percent of the time, against 49 percent for the real people in that income band.
Bain’s framing is the one that holds up: use synthetic customers on top of real research, not instead of it. In their client work that combination delivered comparable insight in half the time at roughly a third of the cost. A 2026 follow-up is more interesting still — digital twins built from a consumer-tech company’s own respondent-level data reproduced about 90 percent of the key outcomes of a prior large conjoint study, including which features actually drove choice, when the original study was excluded from the training inputs. That is a backtest, not a demo, and it is the strongest form of evidence a vendor can show you.
The search space you cannot afford to field
You can run forty concept variants in an afternoon. You cannot run forty concept variants through a human panel without a budget meeting. Colgate-Palmolive’s insight team described exactly this in MIT Sloan Management Review: digital consumer twins let them test scores of concepts at once, where the old workflow forced them to narrow to a handful before any testing happened. Product concepts, they were careful to say, still get validated against real consumers as the gold standard.
That is the honest shape of the win. Not accuracy. Throughput.
Where it loses, and why the loss is expensive
Now the part vendors put in the appendix.
The segment that quietly vanished
Across 285 published silicon-versus-human comparisons, roughly a quarter came out similar, two thirds diverged, and the rest partially aligned — the tally from a 2026 review in NIM Marketing Intelligence Review by Kaiser and colleagues. The pattern behind that number is consistent: aggregates travel, heterogeneity does not. In their own funnel study, simulated respondents matched real brand choices 79 percent of the time while overrating well-known brands and deviating 1.2 points on a seven-point scale, with significantly less spread across respondents than real people showed.
Less spread is not a cosmetic flaw. Segmentation is the business of finding the ten percent who behave nothing like the average. A dataset engineered toward the average deletes the reason you commissioned the study.
The price that came back sixteen percent too high
STRAT7, working with dunnhumby’s Shopper Thoughts community, has now run the same test twice — deliberately withholding a human holdout sample, then asking two synthetic providers to reconstruct it. In 2025, headline agreement was within two to three percentage points, but willingness-to-pay figures ran 16 percent above what real people said, and purely synthetic respondents contradicted their own price ordering 68 percent of the time. Blending with real data brought that to 32.8 percent, which masks the problem rather than fixing it. The 2026 rerun found topline accuracy had improved to within about three points, and then produced the finding that should end a few conversations: synthetic data tracked year-on-year change in brand awareness correctly just 19 percent of the time, missing real movement in 13 of 16 brands. On one subgroup question — women aged 35 to 44 — the real figure was 31 percent and one provider read 14.
A dataset that cannot see change over time cannot run a tracker. That is not a tuning issue. It is a category boundary.
The confidence you did not earn
Synthetic respondents will also tell you what you want to hear, in a way that is harder to catch than human sycophancy. BCG’s 2026 note warns that models can infer the researcher’s hypothesis and generate data that confirms it. Combine that with a tidy variance and a clean dashboard and you have a decision that looks statistically sound and is, in fact, a mirror.
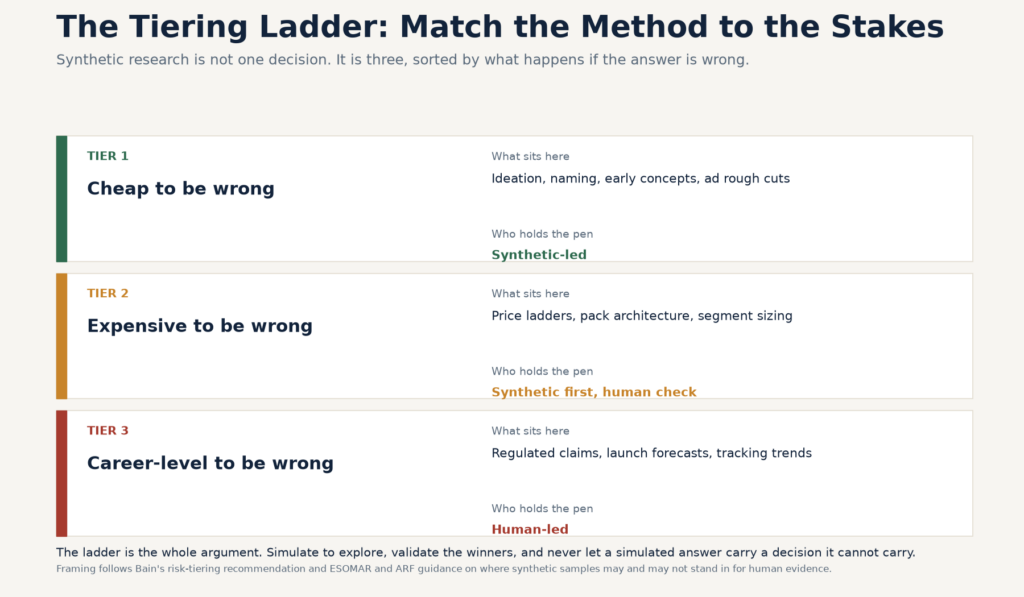
The tiering ladder
So the operating rule is not simulate more or survey less. It is: sort the decision by what happens if the answer is wrong.
Tier one, cheap to be wrong. Ideation, naming, early concept screens, ad rough cuts. Synthetic-led is fine. Run five thousand simulated respondents, get a ranking, discard the bottom eighty percent before anyone books a panel.
Tier two, expensive to be wrong. Price ladders, pack architecture, message hierarchy, segment sizing. Run the synthetic sweep to find the finalists, then put those finalists in front of 150 to 300 matched humans. STRAT7’s own 2026 recommendation runs in this direction: keep synthetic to a bounded share for subgroup work, and validate transparently.
Tier three, career-level to be wrong. Regulated claims, launch volume forecasts, tracking over time, any number that reaches a board deck or a regulator. Human-led, full stop. ESOMAR and the ARF land in the same place — pretesting yes, primary evidence no.
How to run the loop without fooling yourself
Four disciplines separate a calibration programme from an expensive hallucination.
Anchor on a holdout. Before you trust a synthetic panel, hand it a study whose human answers you already own and have not shown it. Bain could show a 90 percent backtest because the client had a prior conjoint to backtest against. If a vendor cannot produce that, you are buying a demo.
Report the distribution, not the mean. A model that nails the average and compresses the spread will pass a topline review and fail a segmentation. Ask for the variance, the tails, and the rejection rate on a none-of-these option. Those three numbers expose most of the failure modes above.
Version the prompt. Bisbee’s drift over three months and the nine-point swing from answer ordering are the same disease: the instrument is unstable. Log the prompt, re-run a fixed benchmark on every model update, and treat any unexplained shift as a data incident.
Say what you did. GRIT 2026 shows synthetic data and personas have moved from a minor chord to a major theme of industry conversation, and disclosure norms are catching up faster than most internal processes. The 2025 ICC/ESOMAR Code revision already requires transparency about AI-generated findings. A footnote is cheaper than a retraction.
The bottom line
Surveys measure what people say. Synthetic respondents model what people do — but only when they are grounded in real behaviour, and only within the slice of questions where variance does not carry the answer. Synthetic wins the search space, the trade-off and the calendar. Human data wins the segment, the trend and the number you have to defend. Anyone selling you one method for all three is selling you a story.
The useful reframe is not that synthetic beats surveys. It is that both are instruments, and you have just been handed a faster, cheaper, more confident one that fails in different places. Knowing where it fails is the entire skill.