Why the ad-tech supply chain got cleaner without ever getting smaller
Insight — Field notes on the 2026 programmatic benchmark data
There is a slide every ad-tech conference has used since roughly 2021: a tangle of pipes on the left, a clean straight line on the right, and the words supply path optimization in the middle. Five years on, the pipe diagram is still the industry’s favourite metaphor.
The benchmark data says the tangle got bigger.
Between the 2023 ANA baseline and the 2025 benchmarks, the median advertiser went from 14 supply-side platforms to 19, and from 22,634 domains and apps to 53,799. Roughly a 36% increase in exchanges and a 138% increase in properties bought. In the same window, made-for-advertising spend fell from 15% to about 0.4% and working media rose from 36% to 47%.
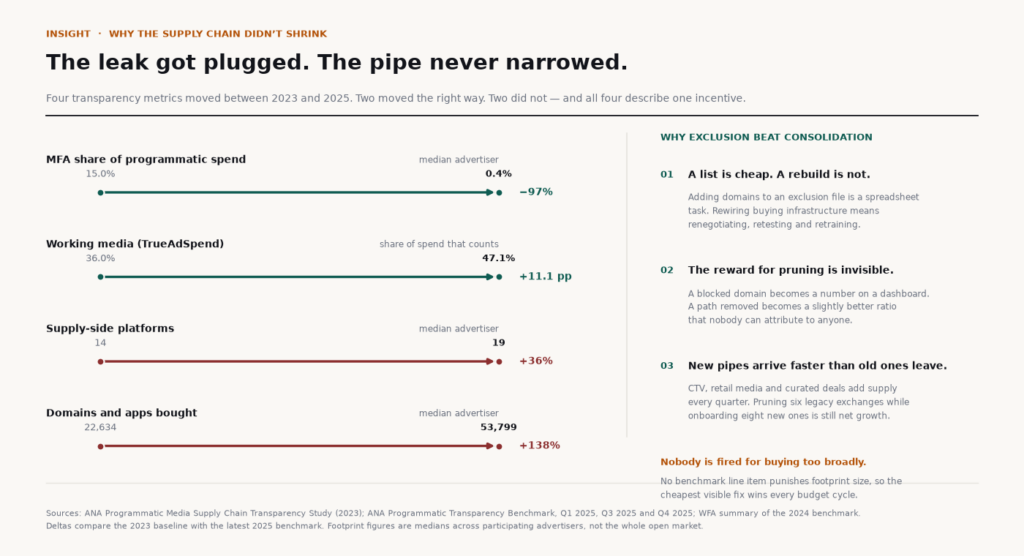
Figure 5 — Four metrics, one incentive. The two that improved were the two that could be fixed with a list.
So the leak was plugged while the pipe widened. That is not a paradox. It is a very precise description of what the industry was actually rewarded for.
Two fixes, two costs
Excluding an MFA domain costs almost nothing. You add a line to a file. It takes an analyst an afternoon, it shows up immediately as a dashboard number moving in the right direction, and it requires no one’s permission.
Pruning a supply path costs a great deal. You renegotiate terms, retest delivery, retrain a buying team, rebuild reporting that referenced the old path, and explain to a procurement function why the number of vendors went down while the budget stayed flat. The benefit — a marginally better working-media ratio — arrives next quarter and cannot be attributed to any single person.
One of these is a spreadsheet. The other is a reorganisation. Budget cycles reward the spreadsheet.
That asymmetry explains the entire shape of the data. Every cheap, visible, reversible fix got made at scale. Every expensive, invisible, structural fix got deferred. MFA exclusion is the former. Supply consolidation is the latter.
Nobody is punished for buying too broadly
Here is the part that rarely gets said out loud: the benchmark suite measures waste after the impression is bought, not breadth before it is.
There is no line item that says “your footprint is too large.” There is a line item that says “your MFA share is too high.” So the rational move is to keep buying broadly and filter aggressively — and that is precisely what the median advertiser did.
It works, up to a point. It got MFA to 0.4%. But exclusion lists are retrospective by construction: you can block the properties you have already found, not the ones that appeared last week inside a pool you have never inspected. The tail is where the next problem will be, and the tail is still growing.
The 19-point hint
The strongest evidence that this is an incentive story rather than a technology story sits in the Q4 2025 spread. The best-performing advertisers converted 56.7% of spend into qualified impressions. The worst converted 37.5%. Same quarter, same benchmark, same tools available on the market.
The difference between those two groups is not access to transparency. It is whether someone inside the organisation owns the number. Where a person owns working media, paths get pruned because pruning is that person’s job. Where the metric belongs to a vendor dashboard, it gets filtered and reported upward.
Consolidation is not a market trend waiting to arrive. It is an accountability structure that has to be built, one contract clause and one named owner at a time.
What the next benchmark should measure
If the industry wants the second half of the job done, it should start publishing supply footprint as a headline metric alongside working media — median SSPs, median domains, and the ratio of new properties added to old ones retired.
Measure breadth, and breadth becomes someone’s problem. Until then, the cheapest visible fix will keep winning every budget cycle, and the pipe will keep widening while everyone celebrates how clean the water is.