The Dashboard Reports. The Framework Decides.
Your dashboard is fine. That is the problem.
It has the tiles. It has the trend lines. Somewhere in the fourth tab there is a cohort chart that took a quarter to build and that nobody has opened since March. When the numbers go red, someone asks a question. When they go green, the meeting moves on. Either way, the same six people leave with the same unresolved argument they were having last month.
That is not a data problem. You have data. You are drowning in it. Supermetrics, which aggregates platform data for a living, analysed 6,000 businesses and surveyed more than 200 marketers for its 2025 report and found that teams were handling 230% more data than in 2020, while 56% said they did not have time to analyse it properly. More data arrived. The number of decisions did not change.
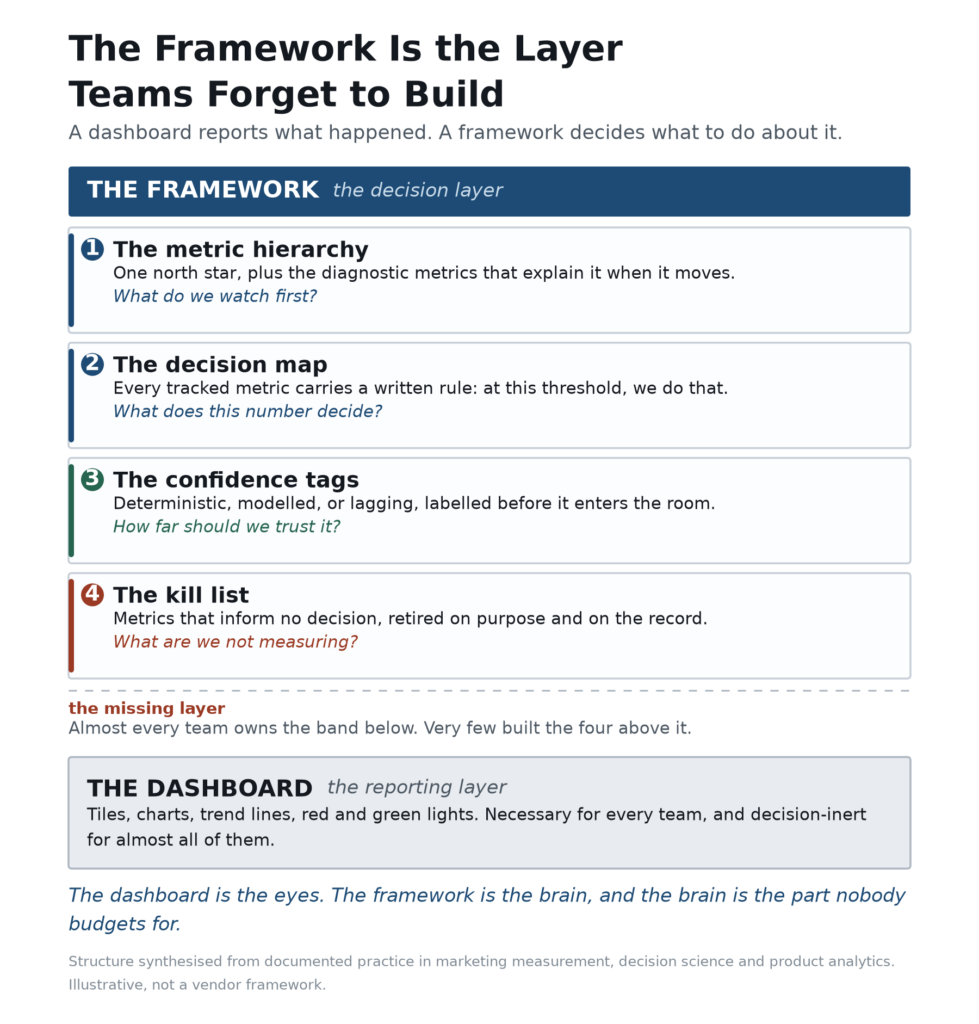
What is missing sits one layer above the dashboard, and almost nobody builds it: the measurement framework. Not a tool. Not a template you download. A written set of rules about which numbers matter, what each one decides, how far you trust it, and what you deliberately refuse to track.
The dashboard reports. It was never designed to decide.
There is a useful way to think about the two layers. The dashboard is the eyes. It aggregates, it displays, it answers the question of what happened, and sometimes it manages what is happening right now. That is genuinely necessary work, and the tools have become very good at it.
The framework is the brain. It answers a different question: so what, and what now?
Here is the distinction that matters. A dashboard tells you that re-purchase rate fell two points. A framework tells you that a two-point fall is inside the noise band for a 90-day cohort, that the third consecutive fall is not, and that when the third one arrives you pause acquisition spend before the retention review rather than after it. The first sentence is information. The second is a decision waiting for its trigger.
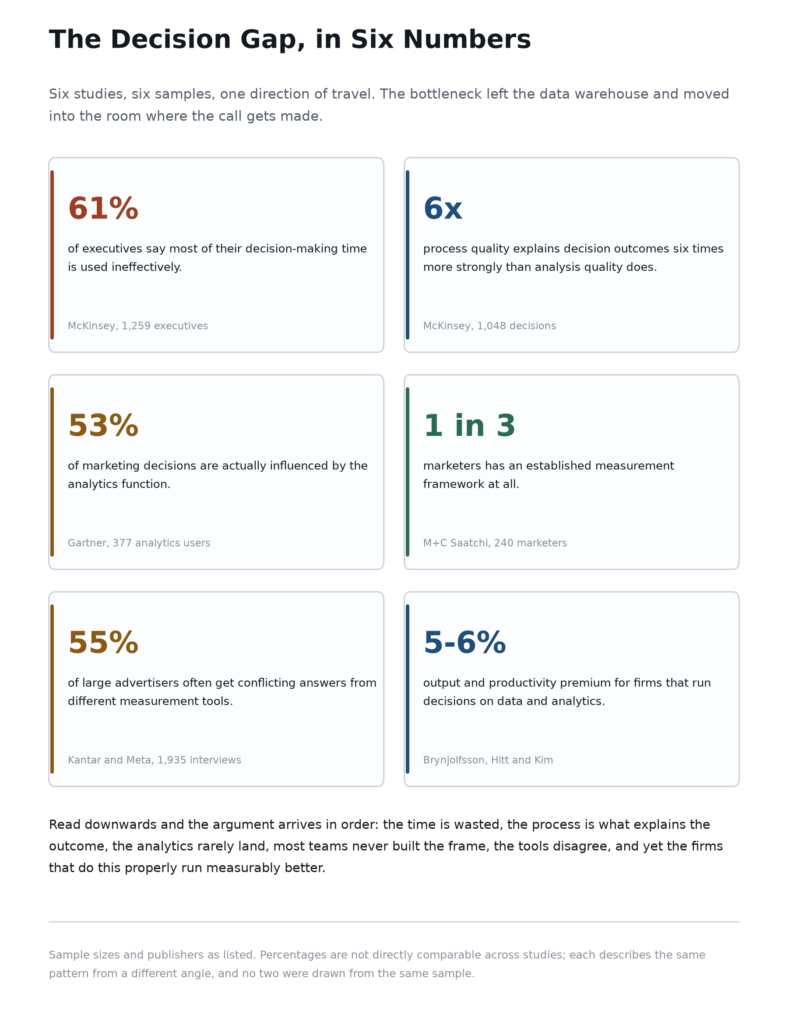
Most teams own the first layer and assume they own the second. They do not. In a survey of 240 marketers published by M+C Saatchi Performance in 2025, only about one in three reported having an established measurement framework at all. A separate global study by Kantar and Meta, drawing on 1,935 interviews with measurement professionals at companies spending over a million dollars a year on digital marketing, found that advertisers use an average of nearly four different measurement solutions to guide decisions, and that 55% of them frequently get conflicting results from those tools. Four instruments, no arbiter. That is not a framework. That is a committee.
Now the harder evidence. McKinsey surveyed 1,259 executives across 91 countries and found that 61% said most of their decision-making time is used ineffectively. Only 37% said their organisations make decisions that are both high in quality and high in velocity. Read that alongside Gartner’s finding that marketing analytics influence just 53% of marketing decisions, from a survey of 377 analytics users, and the shape of the problem becomes clear. The analysis is not the bottleneck. The conversion from analysis to action is.
What a framework actually contains
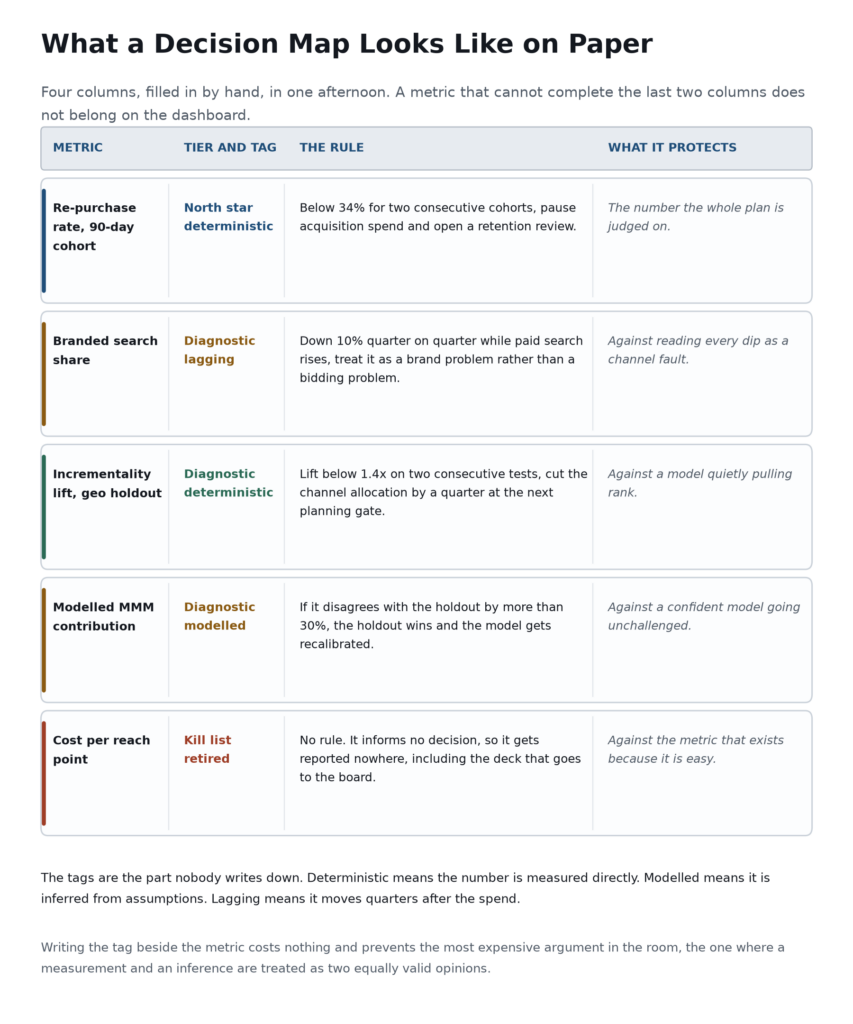
Strip away the vendor language and a working framework has four parts. They are not complicated. They are just rarely written down.
One north star, and the diagnostics that explain it
Pick the single outcome metric that defines success for the business, not for the channel. For a subscription business it might be 90-day re-purchase. For a brand with a long consideration cycle it might be branded search share. For a marketplace it might be nights booked, which is the metric Airbnb settled on precisely because it captures value delivered to both sides rather than activity generated by one.
The north star is deliberately singular. The concept, popularised by Sean Ellis and later formalised into an operating model by Amplitude, rests on a simple wager: if every team optimises against one number that reflects customer value, they will move the business without needing a coordination meeting every Tuesday.
Everything else is a diagnostic. Diagnostics exist to explain the north star when it moves, and they carry less weight by design. This hierarchy is the first thing most teams get wrong. They treat twelve metrics as peers, then wonder why the quarterly review turns into a negotiation about which chart to believe.
The decision map, which is the part nobody writes
For every metric you track, write down the decision it informs. Not the definition. The decision.
The format is almost embarrassingly plain: if this number crosses this threshold, we do that. If incrementality lift falls below 1.4x on two consecutive geo tests, we cut that channel’s allocation by a quarter at the next planning gate. If modelled MMM contribution disagrees with the holdout by more than 30%, the holdout wins and the model gets recalibrated.
Two things happen when you force this discipline. First, a surprising number of your metrics turn out to inform no decision at all, which is useful information you were not previously in possession of. Second, the remaining metrics become actionable, because the action was specified in advance, when nobody was emotional about the number.
McKinsey’s study of 1,048 major business decisions, by Dan Lovallo and Olivier Sibony, produced the finding that should sit above every analytics team’s desk: the quality of the decision process explained outcomes roughly six times more strongly than the quality of the analysis behind it. Their phrasing is worth keeping in full. Superb analysis is useless unless the decision process gives it a fair hearing. A decision map is how you give it a hearing in advance, rather than hoping the right person is in the room on the day.
Confidence tags, so the room knows what it is arguing about
Tag each metric before it enters the meeting. Three tags cover most cases.
Deterministic means the number is measured directly: re-purchase rate from your own transaction data, incrementality from a randomised geo holdout. Modelled means it is inferred: MMM contribution, multi-touch attribution weights. Lagging means it moves quarters after the spend that caused it: brand recall, branded search, share of voice.
The tags are unglamorous and they prevent the most expensive argument in marketing, which is the one where a modelled estimate and a measured outcome are treated as two equally valid opinions. They are not. One is a measurement. The other is an inference with assumptions attached, and the assumptions are what you should be interrogating.
This is where the industry’s numbers get uncomfortable. In the Kantar and Meta study, 55% of large advertisers said they often get conflicting results from different tools. That is not a failure of the tools. That is the normal condition of measurement under privacy constraints, and the framework is what tells you whose answer wins when they disagree.
The kill list, which is the hardest page to write
The fourth component is a list of metrics you have decided, on the record, not to track. Retired cost per reach point. Retired time on page. Retired total impressions, because impressions are an input to a media plan and not an outcome of one.
This is where frameworks meet politics. Every metric on a dashboard has a sponsor, and the sponsor usually has it in their objectives. Removing it is a small act of organisational courage, which is why most kill lists never get written and the dashboard keeps growing.
But the alternative is worse than awkward. When you cannot measure a channel cleanly, you underinvest in it. The IAB’s State of Data 2026 report, based on a survey of more than 400 senior buy-side decision-makers, found that 60% to 75% said advanced measurement falls short on rigour, timeliness, trust and efficiency. Not one respondent believed all their paid channels were well represented in their marketing mix model. Gaming was named as underrepresented by 77% of respondents; commerce media and the creator economy by roughly half.
Sit with that for a moment. Your measurement model is quietly writing your media plan, because the channels it handles badly are the channels that lose the budget argument. A kill list is an act of humility. An unexamined model is an act of bias.
Why the framework is the moat and the dashboard never was
Any competitor can buy the same stack you bought. The tools are, functionally, commodities, and the pricing reflects it. What they cannot buy is your decision logic: your choice of north star, your thresholds, your confidence weighting, your refusal list. That is proprietary in the only sense that matters. It was produced by your business, from your data, and it does not transfer.
There is a second argument, and it is about durability. Forrester’s 2026 analysis of Fortune 500 marketing leadership found that only 36% of companies still use the chief marketing officer title, down from 49% a year earlier, and that average CMO tenure sits at 3.9 years. Marketing leaders turn over. Tools get replaced, merged, sunset, repriced. A framework survives both, because it is a document about how the business decides, not a subscription about how the business reports. When the new CMO arrives, the framework is the thing that tells them why the thresholds are where they are.
And there is a third argument, the one that matters when the numbers conflict. Gartner’s research is blunt about why analytics underperforms: a third of respondents said decision-makers cherry-pick data to support conclusions they had already reached; 26% said decision-makers do not review the analysis at all; 24% said their recommendations get rejected; another 24% said the final call comes from gut instinct. You cannot fix that with a better dashboard. You fix it by making the decision rule explicit before the decision, so that overriding it becomes a visible act rather than an invisible one.
Building one without hiring a consultant
Four moves. One afternoon for the first pass, and a quarterly review thereafter.
Choose the north star out loud, and choose one
Write the sentence: our path to growth runs through this number, and this number is a function of these three inputs. Test it against a simple question. If this metric went up tomorrow, would the customer have received more value, or would the company merely have generated more activity? Revenue fails that test, because revenue is downstream of value delivery and lags it. Signups fail it. Time on page fails it.
Then check that your teams can actually move it within a quarter. A metric nobody can influence is not a north star. It is a vanity metric with better branding.
Write the rule before you need it
Sit with the person who owns each decision and write the threshold and the action. Keep the rules few. Five to eight rules covering the metrics that genuinely drive budget will do more than forty covering everything.
The value here is not automation, and it is worth being precise about that. The value is pre-commitment. When the number moves and the room is tense and someone senior has a strong view, a written rule is the thing that lets you have the argument about the rule instead of about the number.
Tag confidence honestly, including your own
Deterministic, modelled, lagging. Then write down what each tag implies for how much weight the metric gets in a budget conversation. A modelled number can start a conversation. It should not close one on its own.
Revisit the framework itself, on a schedule
Here is the part almost everyone skips. The framework is also a living artefact, and it drifts. Thresholds set in a market with cheap paid social do not hold in a market where paid social costs twice as much. A north star chosen for a growth-stage business may be the wrong north star for a business now defending margin.
Put the review on the calendar. Once a quarter, ask three questions: is the north star still predicting what we care about, are the thresholds still right, and has anything on the kill list earned its way back.
The part that goes wrong
Frameworks fail in four predictable ways, and it is worth naming them before you build one.
The first is mistaking framework for more measurement. It is the opposite. A framework is a reduction. If your new framework has added forty metrics, you have built a larger dashboard and given it a more serious name.
The second is automation as abdication. Decision rules are useful until someone uses them to avoid judgment. A threshold is a trigger for a conversation, not a replacement for one. The moment a team says the framework made the call, the framework has stopped doing its job.
The third is overconfidence in your own confidence tags. Labelling a metric modelled does not make your model right, and labelling it deterministic does not make your instrumentation correct. The tags are claims, and claims need auditing. This is the second-order version of the same bias you were trying to correct.
The fourth is Goodhart. In 1975 the economist Charles Goodhart observed that any statistical regularity tends to collapse once pressure is placed on it for control purposes. Marilyn Strathern restated it in 1997 in the form most people now quote: when a measure becomes a target, it ceases to be a good measure. The moment a diagnostic metric becomes someone’s objective, it starts to be managed rather than measured. A framework needs a review cycle partly because its own thresholds will eventually be gamed.
What this means for the next two years
The tooling layer is about to get much faster and much cheaper. The IAB estimates that AI-driven improvements to measurement could unlock $26.3 billion in media investment value and $6.2 billion in productivity value within one to two years, largely by compressing the loop between data and interpretation. Half of buy-side marketers are already scaling AI inside their measurement programmes.
Faster interpretation makes the framework more valuable, not less. If an AI system can produce a plausible answer to any question in ninety seconds, the scarce resource stops being the answer and becomes the arbiter: which question is worth asking, whose number wins when two systems disagree, and what action follows. Those are framework questions. They are also the questions a machine cannot answer for you, because the answer depends on what your business has decided to care about.
Set against that, the budget context is tightening. Gartner’s 2025 CMO Spend Survey put marketing budgets at 7.7% of company revenue, flat year on year and down from 9.5% in 2022. When budgets compress, the pressure to justify spend arrives faster than the capacity to justify it. A framework is the cheapest defence available, and it is the only one that gets stronger each quarter you use it.
The takeaway
The dashboard reports. The framework decides. Most teams built the first and assumed the second came with it, which is how you end up with a wall of charts, four conflicting measurement tools, and a decision that still gets made on the basis of who spoke last.
You do not need better tools. You need one north star you chose on purpose, a short written list of rules that connect numbers to actions, honest tags about which numbers are measured and which are inferred, and the discipline to retire the metrics that inform nothing.
Brynjolfsson, Hitt and Kim, studying 179 large publicly traded firms, found that companies running decisions on data and analytics showed output and productivity 5% to 6% higher than their other investments would predict, with the effect also showing up in asset utilisation, return on equity and market value. Five to six points is not a rounding error. It is the difference between two competitors with the same budget.
But read the finding carefully. The advantage came from how decisions were made, not from how much data was collected. The firms that won were not the ones with the biggest warehouses. They were the ones that had decided, in writing, what the numbers were for.