We Built an Entire Industry to Count Things That Don’t Matter
There is a moment in almost every marketing review where someone says the words “the data shows,” and the room relaxes. Not because a decision has been made. Because the tension of not yet knowing has been temporarily discharged.
That moment is the product. Not the campaign. Not the customer. That moment.
We have spent fifteen years and an astonishing amount of money building an apparatus whose most dependable output is the feeling that something is being managed. Call it the metric-industrial complex: the interlocking system of platforms, dashboards, attribution models, reporting cadences, and data-driven pieties that has made measurement feel like momentum. It is not a conspiracy. Nobody designed it. It emerged, the way most expensive mistakes do, from a thousand individually reasonable purchases.
And here is the uncomfortable part, the one that makes people shift in their chairs: a dashboard is not a strategy. A chart is not a decision. The sensation of progress is not progress.
What the Metric-Industrial Complex Actually Is
Start with the mechanism, because the mechanism is embarrassingly simple.
More tools produce more metrics. More metrics produce more charts. More charts require more meetings. More meetings create an appetite for tools that promise to fix whatever the last meeting exposed. The loop closes, feeds itself, and spins. At no point in that cycle is anyone required to make a decision. The output of the loop is activity — and activity is legible, defensible, and endlessly renewable in a way that decisions are not.
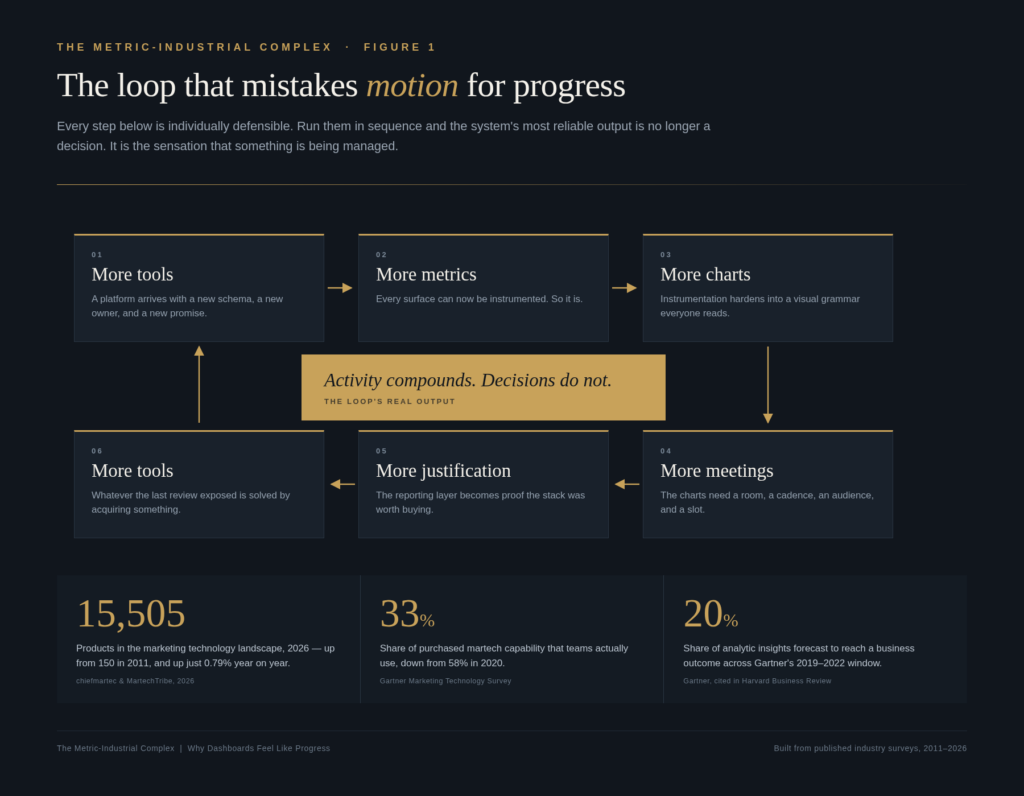
The numbers behind the loop are not subtle. Scott Brinker’s annual census of marketing technology counted roughly 150 products in 2011. By 2026 it counted 15,505. That is a hundredfold expansion in the inventory of things a marketing team could theoretically operate.
But the more revealing figure is what happened to the growth rate. In 2026 the catalogue grew by 0.79% — 121 net additions. Behind that near-flat headline, 1,488 products were added and 1,367 were removed in a single year. The market has stopped expanding and started substituting. We have, in Brinker’s phrase, hit peak martech.
So we bought a hundred times more instruments. How much of the orchestra can we actually play?
Buy More, Use Less
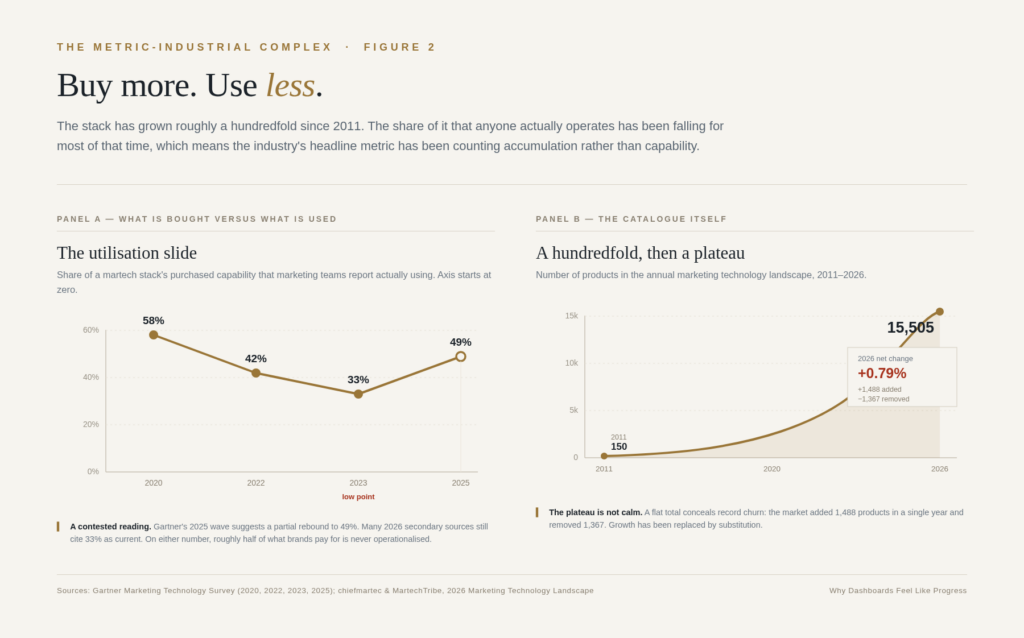
Gartner’s marketing technology surveys have tracked utilisation for years, and the trajectory is the quiet scandal of the discipline: 58% of stack capability in use in 2020, 42% in 2022, 33% in 2023. The 2025 wave suggests a partial recovery to 49%, and I want to be honest about that — the rebound is real, and it matters. But even on the most generous reading, roughly half of what a marketing organisation pays for is never operationalised. Martech’s share of the marketing budget has simultaneously fallen to around 22%, its lowest in a decade, which tells you finance has already done the arithmetic.
A tool at 30% utilisation is not a capability. It is a subscription with a login.
This is the first place where the complex protects itself. Underutilisation is rarely framed as a purchasing error, because purchasing errors are attributable. It is framed as an enablement gap — we need more training, more integration, more headcount to unlock the value we already bought. Which requires, inevitably, another tool.
Why Dashboards Feel Good (Four Reasons, None of Them About Information)
If measurement were merely inefficient, it would be a budgeting problem. It is worse than that, because it is a psychological one. Dashboards are not consumed as evidence. They are consumed as reassurance.
The illusion of control. A dashboard offers mastery in miniature: numbers arranged, trends sloping, red and green lights blinking their verdicts. The feeling of control arrives whether or not the numbers mean anything. And because control feels like competence, the executive who spends forty minutes in a dashboard walkthrough leaves with the same affective payoff as the executive who spent forty minutes making a hard call. The first is cheaper.
The action bias. Marketing has a deep, historically earned fear of being seen as the department of coloured pencils. Sitting with numbers is a socially legible way to be busy. As long as you are looking at the data, you are demonstrably working — even if the looking is the entire output.
Quantification theater. Attach a number to something ambiguous and the ambiguity appears to resolve. “Engagement” becomes a stand-in for interest. Impressions become a stand-in for awareness. The proxy acquires the authority of the thing it was meant to approximate, and then quietly replaces it.
The cover function. And then there is the least discussed motive. Dashboards are defensive equipment. “We’re data-driven” is a shield against the question every CFO eventually asks, and a good report looks like rigour regardless of whether it demonstrates anything. The CMO Survey, run by Duke’s Fuqua School with Deloitte and the AMA, found the pressure intensifying from every direction: 63% of marketing leaders report more pressure from CFOs, up from 52%; 61% from CEOs, up from 51%; and 50% from boards, up from 33% just a year earlier.
When scrutiny rises, the rational response is more reporting. Which is precisely how the loop tightens.
What the Complex Produces
Vanity metrics dressed as insight. Impressions, clicks, reach, engagement rate, pageviews. Every one of them can rise while the business goes sideways. The complex is not badly optimised; it is well optimised — for the production of impressive numbers rather than meaningful ones. And impressiveness is easier to produce.
Measurement distortion. This is the part with a proper intellectual pedigree, and it deserves one. Charles Goodhart’s observation — that when a measure becomes a target, it ceases to be a good measure — was formulated for monetary policy. Donald Campbell made it sharper for social systems: the more a quantitative indicator is used for decision-making, the more it is subject to corruption pressures and the more it distorts the process it was built to monitor. Manheim and Garrabrant later catalogued at least four distinct failure mechanisms, from regressional to adversarial.
Marketing has run this experiment at scale, for free, in public. Optimise for the metric the dashboard can see, and the dashboard becomes a map of what you optimised for rather than what happened. The metric does not lie. It simply stops being about the thing you cared about.
What it hides. Here is the bill. Brand building, trust, differentiation, creative quality, the slow compounding of mental availability — these are the assets that actually move businesses over time, and they are precisely the ones that resist clean quarterly measurement. So they get starved. Not by anyone deciding to starve them. By attrition, by default, by the quiet gravity of whatever fits on the slide.
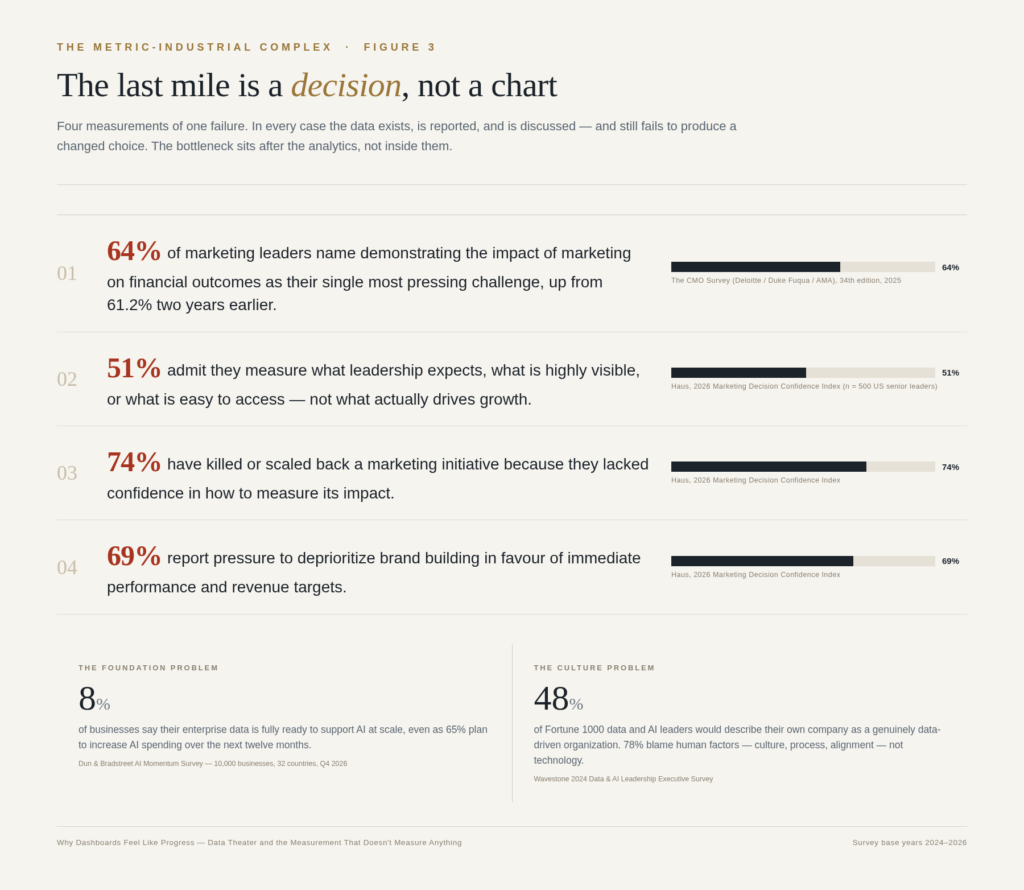
The evidence on this is unusually clear. Les Binet and Peter Field’s analysis of the IPA effectiveness databank put the profit-maximising split at roughly 60:40 between brand building and sales activation, refined to 62:38 in later work. Most organisations run nowhere near that. And when Haus surveyed 500 senior marketing and finance leaders in early 2026, 69% reported pressure to deprioritise brand building in favour of immediate performance targets — and 74% admitted they had killed or scaled back a marketing initiative not because it was failing, but because they could not confidently measure whether it was.
Read that again. Three in four have abandoned work they could not defend. The measurement system is not neutral about which ideas survive. It is the selection mechanism.
The Last Mile Is a Decision, Not a Chart
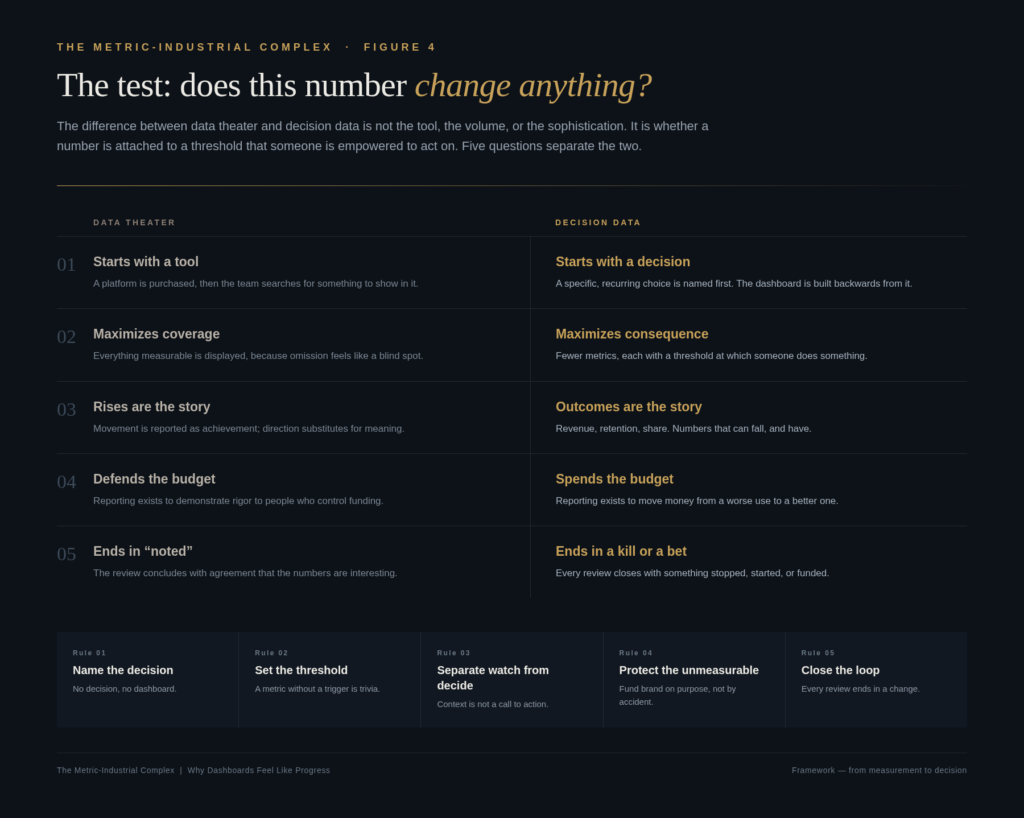
Now we arrive at the real failure, the one that no amount of additional instrumentation addresses.
Data does not become a decision by accumulation. It becomes one when a specific person is authorised to act at a specific threshold. Almost nothing in the average reporting stack is designed around that requirement. The stack is designed around coverage — because coverage feels like safety — and coverage is the enemy of consequence.
Gartner’s analysts made the point bluntly years ago with a forecast that has aged well: through 2022, only 20% of analytic insights would deliver business outcomes. The phrasing matters. Not 20% of insights would be wrong. Twenty percent would reach an outcome. The other eighty percent were, by construction, correct and inert.
The CMO Survey confirms the pattern from the marketing side: 64% of marketing leaders now name “demonstrating the impact of marketing actions on financial outcomes” as their single most pressing challenge, up from 61.2% two years earlier. Note what that number is not. It is not “we lack data.” It is “we cannot convert what we have into a defensible claim.” Those are different problems with different solutions, and the industry keeps funding the first one.
Haus found something even more pointed: only about half of senior marketing and finance leaders can clearly explain their measurement approach to the board — while 90% believe marketing drives growth, and roughly a third concede that more than a fifth of their budget is inefficiently allocated. The confidence is real. The explanation is missing. That gap is the complex’s core product.
Underneath all of it sits a foundation problem that no dashboard can paper over. Dun & Bradstreet’s AI Momentum survey — 10,000 businesses across 32 countries — found that just 8% describe their enterprise data as fully ready to support AI at scale, even as 65% plan to increase AI spending. Among companies with fully ready data, 81% report broad or strong returns. Among those with partially ready data, 12% do. We are pouring intelligence into pipes that were never built for it.
And the constraint is not technical. Wavestone’s annual survey of Fortune 1000 data and AI leaders found that 48% would describe their own company as genuinely data-driven, while 78% point to human factors — culture, process, alignment — as the barrier. Only 23% blame technology. The tools were never the problem. They were the alibi.
Where the Defenders Are Right
I want to steelman the other side properly, because the cheap version of this argument is “measurement bad, vibes good,” and that version is wrong.
You cannot manage what you do not measure, and the decades in which marketing could not defend a single line of its budget were not a golden age of creative courage. They were an era of arbitrary cuts and unaccountable spend. Measurement genuinely improved the discipline. And in most organisations, the alternative to imperfect data is not better judgment — it is louder opinion, held by whoever has the most seniority and the least sleep.
The strongest academic evidence points the same way. Erik Brynjolfsson, Lorin Hitt and Heekyung Kim, studying 179 large publicly traded firms, found that those emphasising data-driven decision-making had output and productivity 5-6% higher than their other investments and IT usage would predict — with the effect showing up in asset utilisation, return on equity, and market value, and surviving instrumental-variable tests for reverse causality. Data-driven firms really do perform better. That finding is not in dispute here.
So the thesis is not that measurement failed. The thesis is that measurement overshot. The complex is the corruption of a good instinct, not a refutation of it. Somewhere between “we can’t prove anything” and “we have 240 KPIs” there is a narrow, unglamorous place where measurement earns its keep — and the industry’s incentives point away from it in both directions.
The Antidote: Starve the Theater, Feed the Decision
Five rules. None of them require a new platform, which is why none of them are popular.
Rule one: name the decision before you build the dashboard. Before anything gets constructed or opened, ask what specific, recurring choice this is meant to inform. Not “give visibility into.” Not “track performance.” A choice, with a person attached to it. If the answer is a shrug, you have just saved yourself a quarterly subscription and a standing meeting.
Rule two: attach a threshold or delete the metric. A number without a trigger is trivia. If the metric crosses a line and nobody does anything differently, the line was decoration. Fewer metrics, each with a documented “if this, then that,” beats a wall of context every time.
Rule three: separate watching from deciding. Most of what sits on a dashboard is context — useful ambient information, not a call to action. Context deserves a folder. Decisions deserve the top of the page, the standing agenda item, and the executive’s attention. Conflating them is how fifteen minutes of signal gets buried in forty-five minutes of scenery.
Rule four: protect the unmeasurable on purpose. If brand, trust, and creative ambition are only funded when they can be justified by short-term numbers, they will be funded at zero. The 60:40 evidence exists to be used in a budget conversation, not admired in a deck. Ring-fence the long term explicitly, in writing, with a number — because silent neglect is what happens by default.
Rule five: end every review in a kill or a bet. This is the whole thing, honestly. Every reporting session must close with something stopped, something started, or something funded. “Noted” is not an outcome. If a meeting cannot produce a change, the meeting is the product, and you should price it accordingly.
What This Looks Like on a Monday
Concretely, the escape is smaller than it sounds. It is one conversation with a finance partner about which three numbers would actually change a quarterly decision. It is deleting four of the eleven charts on the weekly deck. It is writing down, for the first time, the threshold at which you would pull spend from a channel. It is putting a brand investment on the plan with a number attached and a three-year horizon, and refusing to let it be judged on a fourteen-day window.
None of that is a transformation programme. It is a series of small refusals.
And refusals are what the complex cannot survive, because the complex runs on participation. Every unnecessary metric that gets reported is a vote for the machine. Every meeting that ends in agreement rather than action is another turn of the loop.
The Point
We built an extraordinary measurement machine, and its finest product turned out to be a feeling: the sense, at the end of a well-run review, that the business moved forward. Sometimes it did. Often the numbers moved and the business didn’t.
The escape is not to abandon data — the evidence for data-driven decision-making is too strong, and the alternative is worse. The escape is to starve the theater. Ask what decision each number informs. Keep only the metrics that trigger real choices. Deliberately, explicitly, budget for the things a dashboard cannot see. And insist that every review end with something changing.
Progress is not a dashboard. Progress is a decision that changed something — and you can tell the difference, because a decision has a cost, and a dashboard never does.