Everyone Blames Token Prices. The Real Reason Marketing Lost the AI Budget Is That It Can’t Prove an Outcome.
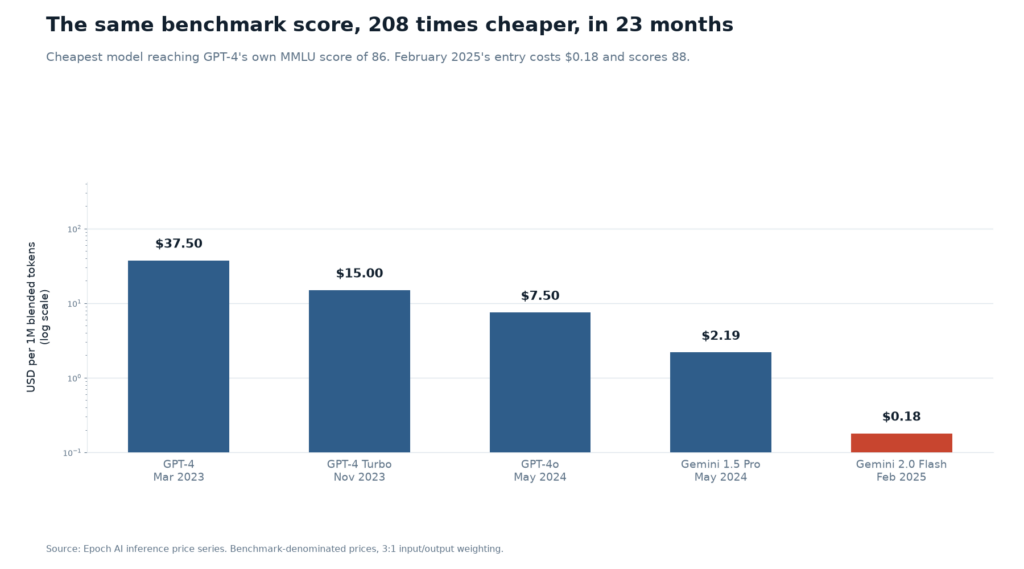
Here’s a number that should have reorganised your 2027 plan: the price of reaching GPT-4’s own benchmark score fell 208-fold in twenty-three months. From $37.50 per million blended tokens to $0.18. And the model that costs $0.18 scores higher on MMLU than the one that cost $37.50.
Now here’s the number that should make you suspicious of the first one. Menlo Ventures puts enterprise AI deployment spending at an annualised $176.8 billion by September 2026, against $33 billion a year earlier. Average spend per enterprise rose 4.7 times. Those same companies had budgeted for about 1.9 times.
The price of the unit collapsed. The size of the bill exploded. Both things are true, and the gap between them is where the martech industry is being sorted into winners and inventory. If you take only one of those numbers into your planning, you will get the strategy exactly backwards.
What actually happened to the price of a thought
The cleanest measurement comes from Epoch AI, which tracked not the price of a token but the price of a capability — the cheapest way to hit any given score on maths, hard science and reasoning benchmarks. Since 2023 that price has fallen about 47% per quarter, or roughly 13 times a year.
That is not a normal deflation rate. Epoch put it four times faster than DNA sequencing, six times faster than computing, eighteen times faster than lithium batteries, and — against electricity’s century-long decline — fifty-four times faster. No general-purpose technology in the record has gotten cheap this fast.
The drop is also front-loaded, which matters if you are forecasting. A capability is most expensive the moment it debuts as state of the art, then gets cheaper by roughly 66% a quarter. Two years on, it is still deflating, but at 32% a quarter. The discount has a half-life. A business case that assumes 2024’s rate of decline continues indefinitely is extrapolating from the steepest part of the curve.
The single most vivid data point: OpenAI’s o3 hit 75% on GPQA Diamond, a set of PhD-level science questions, at about 30 cents a question in January 2025. Eighteen months later, GPT-5.6 Luna hit the same score for $0.0004 a question. Roughly a 725-fold collapse in the cost of a correct answer.
Three numbers, three different claims
You will see three deflation figures quoted in board decks, and they are not interchangeable.
Epoch’s March 2025 analysis found per-token prices for a fixed performance threshold falling between 9 and 900 times a year, with a median of 50 — rising to a median of 200 once pre-2024 data was excluded. A separate study by Gundlach and co-authors put the frontier price-performance decline at 5 to 10 times a year, and isolated algorithmic efficiency progress at about 3 times a year once hardware effects are stripped out. Stanford’s AI Index 2025 reported that GPT-3.5-level inference got more than 280 times cheaper between November 2022 and October 2024.
They disagree because they measure different objects over different windows. They agree on the direction, and on something far more useful: the decline is fastest at the top of the capability range and slowest at the bottom. Gundlach’s team found the strongest models deflating at roughly 32 times a year while the weakest managed about 1.7 times.
Read that again, because it inverts the story most vendors tell. Cheap inference did not flatten the market. It widened the gap between the frontier and everything trailing it.
The number I’d trust least
The 9-to-900 range comes from one study, one methodology, barely three years of data. It measures per-token API list prices, excludes reasoning models, and weights input three to one over output. Epoch itself flags benchmark contamination, noisy observations, and the awkward fact that scoring well on a test is not the same as doing useful work.
There is also a genuine dispute about how much of the decline is real cost reduction and how much is margin compression. Both produce a lower sticker price. Only one is durable. Published prices cannot tell you which you are looking at, and nobody has established any provider’s internal unit cost.
So: direction beyond argument, rate not. Plan for roughly an order of magnitude a year and treat anything more aggressive as a bonus rather than a baseline.
The part nobody put in the press release: your bill went up
Why didn’t cheaper tokens shrink the bill? Because of what got cheaper and what got bought.
Agents now account for 80% of tokens on OpenRouter, about seven times human-driven usage, and that traffic has grown 37-fold since February against 5-fold for humans. An agent doesn’t ask one question; it grinds through a workflow, spins up parallel threads, and keeps spending after you go home. Spending scaled with work rather than headcount.
And buyers traded up, not down. A year ago the default enterprise picks were Claude Sonnet 4.5 and GPT-5. Today they are Claude Opus 5.5 and GPT-6 Astra — considerably dearer per token. Frontier models’ share of tokens doubled from 18% to 42%, and their share of spending rose from 35% to 63%.
That is the whole trick, and it deserves naming plainly: the price war is real, but it is being fought at the bottom of the market while the money runs to the top. Frontier labs cut small-model prices by 80% or more, and small closed models still lost token share, from 29% to 13%. Meanwhile Anthropic and OpenAI hold 86% of enterprise API spend between them. Google slipped from 21% to 9%.
One caution on the 4.7-times figure, because averages lie. Menlo’s own distribution shows a median of 2.2 times against a plan of 1.8. A small cohort of heavy agent adopters dragged the mean upward. If you are building a 2027 base case, anchor near the median and model agentic workloads separately with a ceiling per workflow. The average is a headline; the median is a budget.
Where the money actually went (and where marketing didn’t)
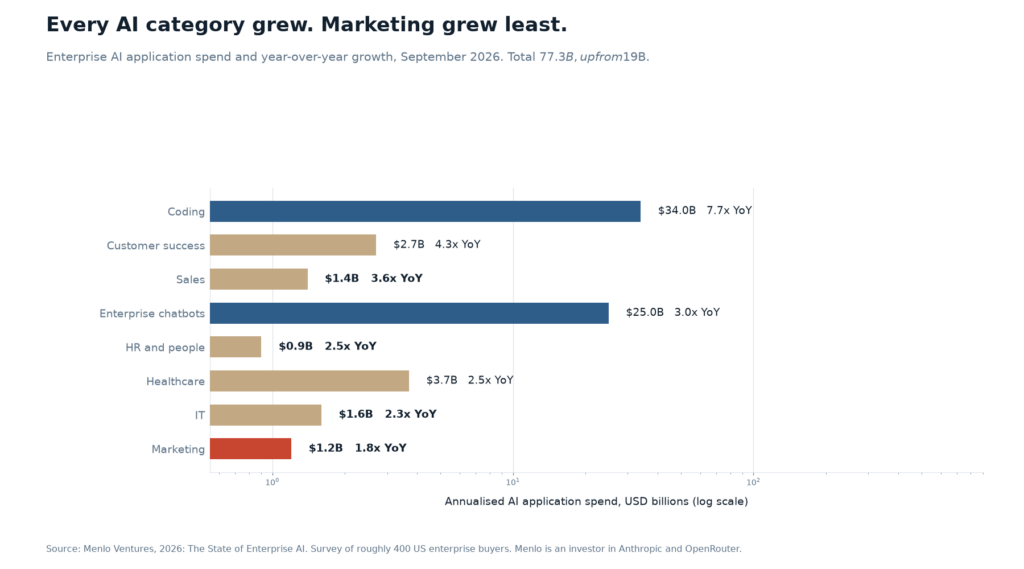
Here is the finding that should stop a CMO mid-sentence. Menlo’s application layer totals $77.3 billion. Coding took $34.0 billion — up 7.7 times. Enterprise chatbots and assistants took $25.0 billion. Those two categories alone are 76% of all AI application spending. Healthcare, one of the largest industries on earth, took $3.7 billion. IT took $1.6 billion.
Marketing took $1.2 billion. It grew 1.8 times — the slowest multiple of any function in the report.
Sit with that. Marketing has been the loudest claimant to the AI revolution for three years, and it captured about 1.6% of enterprise AI application spend while growing more slowly than HR.
Menlo’s own explanation is the most useful thing in the report. Spend concentrates where three conditions hold: environments agents can act in, complete context agents can learn from, and — decisively — outcomes agents can verify. A compiler checks whether code builds. Tests check whether it behaves. A ticket either resolves or it doesn’t.
Now the uncomfortable question. What is the verifiable unit of a good campaign? A brand film that lifts awareness by an amount nobody can agree on, measured by an attribution model everyone distrusts? An agent cannot close that loop. Neither can your CFO.
That, not the price of a token, is why marketing’s AI budget grew 1.8 times while coding’s grew 7.7. Cheap inference did not unlock marketing. It exposed that marketing had never defined its output precisely enough to automate.
The wrapper tax, itemized
If inference is cheap and getting cheaper, what exactly were you paying for when you bought an AI content tool in 2023?
For a lot of products: a prompt, a template gallery, and a subscription. The margin was never the software — it was arbitrage on model access, and arbitrage has a shelf life measured in quarters.
Google’s Darren Mowry said the quiet part out loud in February 2026. Companies counting on the back-end model to do all the work, effectively white-labelling someone else’s intelligence, have their “check engine light” on. His advice to founders was blunter than executives usually risk: “Stay out of the aggregator business.”
The AWS-reseller déjà vu
Mowry’s analogy is the sharpest frame available. In the late 2000s a cohort of startups resold AWS capacity with nicer billing and a support line. When Amazon built its own enterprise tooling and customers learned to manage cloud directly, the resellers were squeezed to nothing. The survivors sold security, migration and DevOps — work that required knowing something about the customer’s business.
Aggregators are that business again, one abstraction layer up. Model providers keep shipping governance, routing, caching and evaluation tooling themselves. Every capability the middleman added becomes a checkbox on the provider’s pricing page.
Why the middle of the market is the bonfire
Scott Brinker’s 2026 martech census counts 15,505 products, and almost nobody read the headline correctly. Growth was 0.79%. The first plateau in fifteen years. Fifteen thousand five hundred products, up from 150 in 2011.
Look underneath. 1,488 products entered. 1,367 left. Additions fell 40% year over year while removals rose 13%. The flat line is the sum of two opposite accelerations.
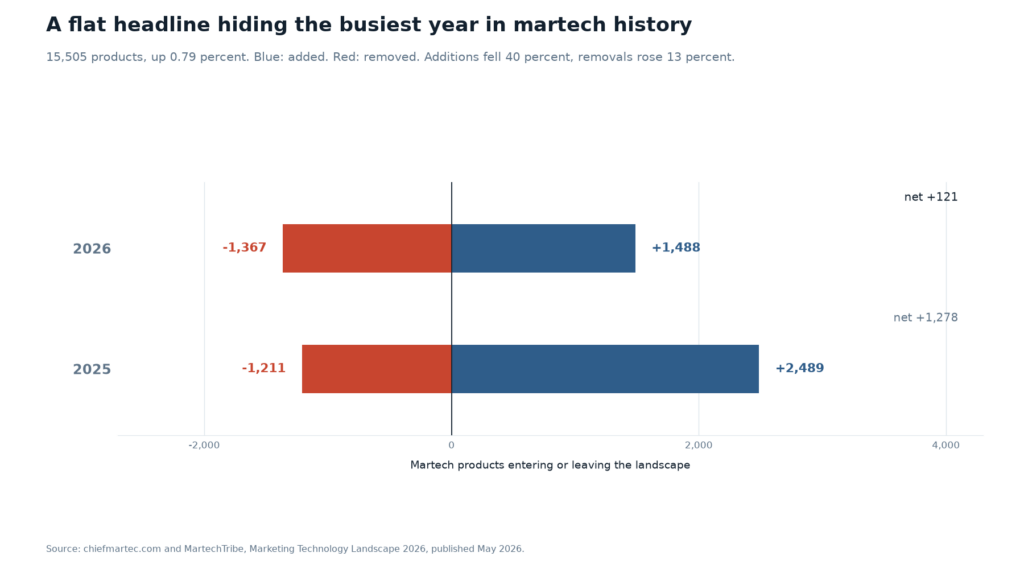
Who left tells you what is happening. 51.7% of exits came from companies founded between 2010 and 2019 — the first great SaaS martech generation. 45.5% had revenue between $1 million and $10 million. These were not failed experiments. They had customers, revenue and teams. They never reached the scale where an incumbent bundling AI from above and an AI-native attacker pricing from below could not squeeze them.
The largest single-category contraction was content marketing: 176 products left, 139 arrived, a net loss of 37. The category that doubled through the generative AI boom is now bleeding hardest. My reading — not Brinker’s — is that products wrapping a 2023-vintage model in a content-marketing interface are being absorbed by the models themselves and by the suites.
Notice what grew instead: CMS and web experience management up 21.4%, ecommerce up 19.9%, mobile and web analytics up 11.3%, iPaaS up 8.0%, governance and privacy up 7.1%, marketing automation up 5.9%.
Seven of the seven fastest-growing categories are plumbing. Integration, measurement, permissions, orchestration. Not the demo layer — the wiring. Read that as a procurement signal: the next dollar belongs in foundations that make existing tools agent-readable, not in another point solution with a chat box.
Four moats a price cut cannot erode
So what survives? Not access. Never access. Here is the filter I would apply to any AI martech contract this quarter.
Data you cannot download
A model knows the world. It does not know your customers, your margin structure, your returns rate by SKU, or which enterprise accounts renew in March. Any vendor whose value proposition survives being pointed at a public API has no value proposition. Ask directly: what does your system know about my business that a general model does not?
Menlo found post-training adoption still low — 10% of builders, up from 6% — and 91% of those who do it use outside partners. That is not a weakness in the thesis; it is evidence that specialised models are hard, which is precisely why they are defensible.
Workflow, not a prompt
The tools holding ground in Menlo’s data sit inside systems of record: ServiceNow at 91% of IT, Databricks and Snowflake at 88% of data science, Workday at 68% of HR, while AI-native vendors hold 96% of coding. AI had to fit inside an existing workflow, so the incumbent kept the account. Marketing’s equivalent is the orchestration layer — segment, trigger, suppress, measure, reconcile. A generation endpoint is a feature. A pipeline is a business.
Owning the outcome
HubSpot’s April 2026 repricing is the template. Breeze Customer Agent moved from $1.00 per conversation to $0.50 per resolved conversation. Prospecting Agent moved from a monthly per-contact charge to $1 per lead recommended for outreach. Their stated logic is that AI should be paid for on the value it delivers, not the compute it consumes.
That is a vendor betting revenue on its own resolution rate. Customer Agent resolves 65% of conversations and shortens resolution time by 39% across more than 8,000 customers — good enough to underwrite the bet. If your vendor won’t price on outcomes, ask what they know about their own failure rate that you don’t.
Cost architecture as a feature
Cheap inference is an advantage only if you keep it. Vendors that pass deflation through, or reinvest it in depth, compound. Vendors that pocket it and hold list prices flat are running a margin harvest — and they are the ones whose renewal conversation gets ugly.
The second price war is about how you pay
While everyone watched token prices, the billing model quietly changed underneath.
HubSpot is the visible case, but the pattern is broader: per-seat subscriptions converting to credits, credits converting to resolved outcomes, and AI consumption moving onto its own line in the contract. Adobe runs the same experiment from the other end — identical subscription, metered generative credits inside it, and a separate credit line that surfaces at renewal as a second increase on top of the visible one.
This should concern you more than the deflation rate does. Under per-seat pricing your cost is fixed and your risk is adoption. Under outcome pricing your cost scales with success and your risk is definition. Who decides what counts as resolved? What happens when resolution rates climb from 65% to 90% and your per-unit bill rises on flat volume? Run that arithmetic before you sign, not at renewal.
Gartner’s budget reading is grimly consistent. CMOs put 15.3% of marketing budget into AI while only 30% report fully developed AI readiness — and martech already absorbs 19.4% of the marketing budget. There is not much room left to keep funding experiments.
What to do Monday morning
Audit for the wrapper tax
Pull your AI line items and sort them into three buckets: tools that own data you can’t get elsewhere; tools embedded in a workflow you’d struggle to rebuild; tools that are a prompt with a login. The third bucket is your wrapper tax. Either replace it with direct model access or renegotiate it down to what it actually is.
Renegotiate on the deflation curve
You now have a defensible planning number: roughly an order of magnitude a year at the frontier, closer to 3 times for underlying algorithmic efficiency. Put that curve into your renewal conversation — not as an accusation, as an input. Ask what portion of your price is inference, and what happens to it next year.
Buy outcomes, not access
When two vendors offer the same capability, the tiebreaker is not the model they use. It is whether they can state a verifiable unit of success and price against it. If neither can, you are buying access to a commodity and should pay commodity prices.
Price the churn risk
About one in eleven products on Brinker’s map left last year. Add a survival question to every evaluation: funding runway, revenue band, customer concentration, position relative to the squeeze. A cheaper tool from a vendor that disappears in fourteen months is not cheaper.
The uncomfortable conclusion
The pricing war did not democratise AI marketing. It did something more useful and less flattering: it removed the excuse.
When inference was expensive, everything was explainable. Slow personalisation? Cost. No real-time testing? Cost. Thin output? Cost. That alibi is gone. A capability that cost 30 cents a question eighteen months ago costs four hundredths of a cent now, and the budget still went to coding.
The money moved to where outcomes could be verified. Marketing’s next job is not to buy cheaper tokens. It is to define — precisely, in a form a machine can check — what a good outcome actually is. Do that, and deflation becomes leverage. Skip it, and you will keep paying a wrapper tax on intelligence that has already become a commodity.
The short version
Inference prices collapsed — roughly 13 times a year at a fixed capability level, 208-fold on GPT-4’s own benchmark in under two years. Enterprise AI spend rose 5.4-fold anyway, because agents multiplied volume and buyers traded up to frontier models. In martech, a flat 0.79% product count hides a market being rebuilt: 1,367 exits, 51.7% of them from the 2010–2019 SaaS cohort, and content marketing losing most. Marketing captured about 1.6% of AI application spend and grew slower than any other function — not because tokens were expensive, but because marketing never defined a verifiable outcome. The winners will be tools with proprietary data, workflow gravity, and the nerve to price on results. Everyone else is selling arbitrage on a price that keeps falling.