The Average Behind the Misallocation: Why the Expensive Half of Search Keeps Getting Funded
Here is a fact that should not survive a single budget meeting. Across 13 established Norwegian brands that together spent 123 million kroner on Google Ads, non-brand conversions cost roughly six times what brand conversions cost — and in the worst case in the sample, thirty times. Brand keywords returned about eight times the ROAS. And four fifths of the money still went to the expensive side.
Read those numbers again and the natural reaction is incompetence. It is not. The people running those accounts were competent, and most of them had the data in front of them.
So why does the misallocation persist? The answer is not in the keywords. It is in the arithmetic of the number they were reading.
The mechanism is subtraction by averaging
Cost per conversion is almost always reported as a blended figure — total spend divided by total conversions, aggregated across every keyword in the account. That single number is mathematically honest and commercially useless, because it is a weighted average of two populations with wildly different economics.
Brand queries convert cheaply. Non-brand queries convert expensively. Blend them, and the cheap half drags the average down toward itself. The expensive half then appears to sit comfortably near a number it has nothing to do with.
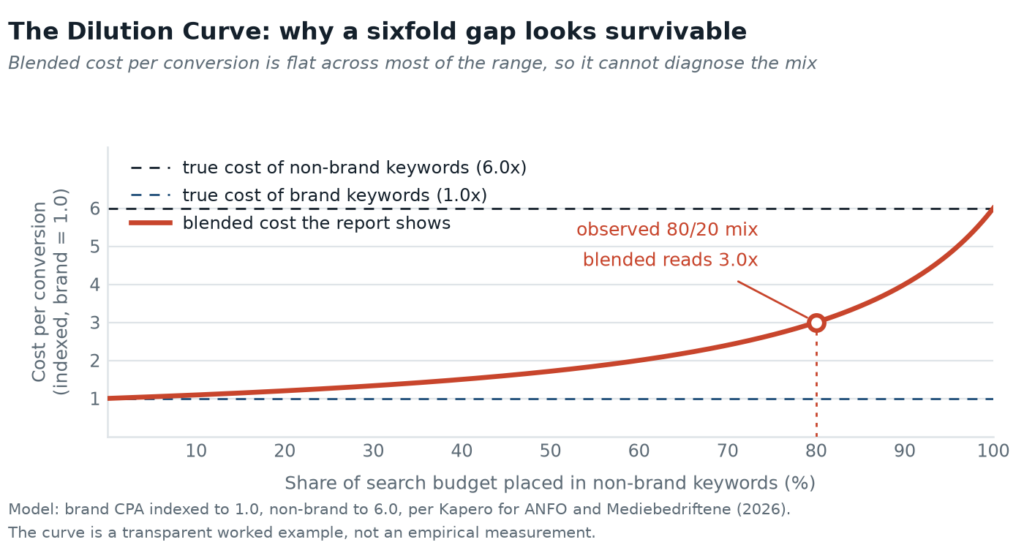
At the 80/20 split, the blended number lands at 3.0x. The expensive segment’s actual cost is 6.0x. The report reads “acceptable” while describing a channel that costs twice what the report implies. Scale that campaign and the average moves by almost nothing — the curve stays flat, so the decision feels safe. The feedback loop that normally punishes a bad allocation has been muted by the aggregation itself.
Three forces keep it in place
The average is a single line. Dashboards inherit the blended figure because it is the default export. Nobody chose it; it arrived pre-aggregated. A number that cannot be wrong at the account level cannot reveal that the account is split into two businesses.
The window flatters the harvest. Brand campaigns capture demand that was created earlier, often by media that never appear in the same report. Within a 30-day attribution window, the brand line looks like the hero and the upper-funnel work looks like a cost. The account-level view cannot see the handoff, so it credits the catcher and defunds the thrower.
The incentive points at scale. More spend produces more reported conversions. Split the reporting and the expensive half stops looking scalable — which is not a conclusion anyone is rewarded for reaching. As ANFO’s project director put it, the setup is, bluntly, a system designed to make you spend more.
What breaks the loop
Not a better dashboard. A different unit of analysis. The Norwegian project worked because it refused to report at the account level: brand and non-brand were separated first, then measured. The moment the two populations are kept apart, the average stops laundering the gap and the allocation question becomes answerable.
That is the whole insight, and it is uncomfortable: the metric was never hiding the inefficiency from you. It was hiding it inside itself, in the one place a summary always hides things — the middle.