Your Branded Search Is Rising. Your Branded Traffic Isn’t. Here’s Why That’s Fine — and What It Costs You.
Here is a strange thing about the last decade of marketing. We built spectacular instruments for watching demand get captured — click paths, attribution windows, return on ad spend — and almost none for watching demand get created. Then we looked at the instruments, saw nothing about brand building, and concluded brand building was unmeasurable.
It was measurable the whole time. We just stopped looking at the one meter that tells you whether anyone remembers your name. Ask yourself honestly: when did you last open Google Trends and check whether people searched for you?
The metric hiding in plain sight
Brand search volume is the count of searches for your name — “Nike,” “Nike running shoes,” “is Nike worth it,” plus every misspelling and half-remembered variant people actually type. It is free. It goes back roughly two decades. It exists in every market where a search box exists. And for reasons I will get to, it never made it onto the dashboard that matters.
What makes it different from everything else in your reporting is when it happens. A click is what someone does after they have already decided to consider you. A brand search is what someone does when your name surfaces in their head before they have decided anything. It is not the moment of capture. It is the moment of recollection.
Why navigational intent is the highest intent there is
Search practitioners classify a query like “ASOS returns policy” as navigational — someone looking for a specific place, not a category. Navigational queries are the least contested and the most likely to convert, because the person arriving has already chosen. That is precisely why brand search is such an uncomfortable metric. It is not measuring your media plan. It is measuring the memory your media plan built, several steps upstream of the click you were congratulating yourself about.
Think of it as the difference between a full restaurant and a restaurant people recommend. Your reservation system cannot tell the two apart. The queue at the door can.
Why it earns the word north star
I do not use that phrase casually. A north star metric has to do three things: predict outcomes you care about, resist being gamed, and move for reasons that are actually about your brand. Brand search does all three.
It leads conversion
People who arrive by searching your name convert at a rate that ad-served traffic rarely approaches. Agency-side benchmarks put branded first-position click-through at roughly 35.7% against 28.2% for non-branded in the same positions, and conversion gaps of two to three times are routine. But the more interesting number comes from the paid side. In the Norwegian research I will discuss shortly, non-brand conversions cost roughly six times what brand conversions cost on average, and in the worst case in the sample, thirty times.
Reread that. The demand you created is cheaper to convert than the demand you intercepted.
It leads the money you keep
Anyone can buy a conversion. Discount deep enough and the transaction happens. What discounting cannot buy is someone typing your name when the discount is over. Brand search is a rough readout of whether the relationship survived the promotion. If your brand search line is flat while your promotional calendar is full and your revenue is holding, you have been renting your customers and calling it growth.
It leads share
This is the strongest documented claim in the whole argument, and it comes from the Institute of Practitioners in Advertising, not from a vendor with software to sell. Les Binet’s 2020 work found branded share of search to be a leading indicator of market share; for cars, the lead time ran up to a year. When share of search moved, share of market followed.
The evidence got stronger in 2026, not weaker
If you were expecting the AI era to bury this metric, the data says the opposite. Three findings from this year matter more than anything published in the previous five.
The Norwegian test: 13 brands, one uncomfortable number
An analysis firm called Kapero ran the numbers for two Norwegian trade bodies — the advertiser association ANFO and the media association Mediebedriftene — across 13 well-known brands that had together put 123 million kroner into Google Ads. It won a WFA President’s Award in Stockholm this year, partly because the method travels.
The setup is the part worth stealing. They split every search into brand and non-brand, then looked at what each half actually produced. On the surface, Google looked like it drove about 60% of traffic, conversions and revenue. Underneath, most of that value was coming from people who already had the brand in mind and typed its name. Non-brand conversions cost six times more on average, up to thirty times in the worst case. Brand keywords returned roughly eight times the ROAS. And 80% of the money went to the expensive side.
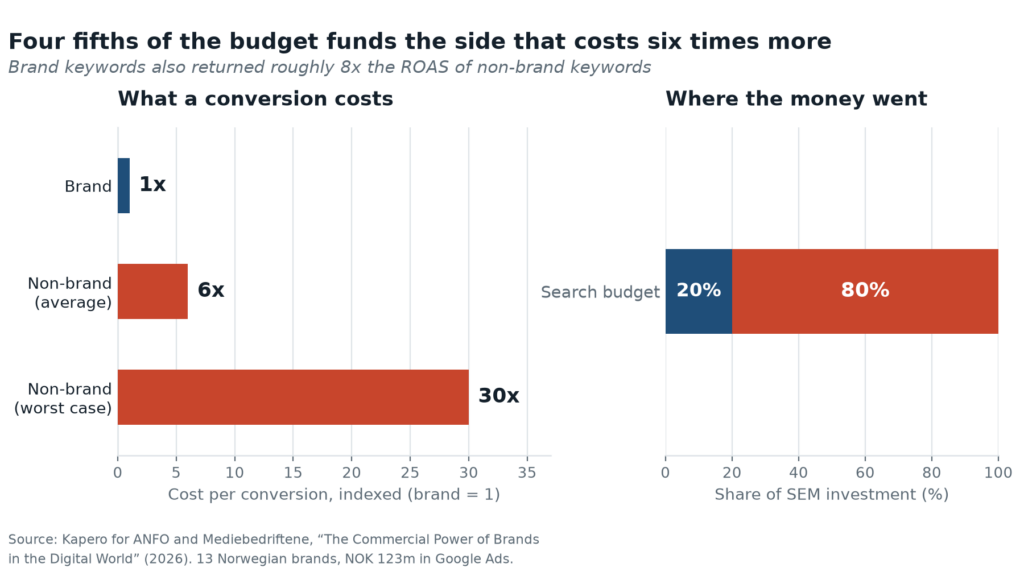
The reason for that misallocation is not stupidity. It is averaging. Blended cost per conversion looks tolerable because the brand campaigns are so efficient they drag the average down, which makes the non-brand campaigns look like they have room to scale. The reporting hides the leak. One more detail from the same study: 90% of revenue came from 5% of keywords, and those keywords took about half the budget — meaning the other 95% competed for the remaining results with the other half.
The 83% finding, correctly stated
You will see it quoted as a correlation coefficient. It is not. The IPA’s share-of-search think tank, led by James Hankins and building on Binet’s work, found across 30 case studies, 12 categories and seven countries that share of search represents about 83% of a brand’s share of market on average. That is a ratio, not an r-value, and the IPA is explicit that these are correlations rather than causal relationships. The ratio also varies meaningfully by category and country, so your 83% is not my 83%.
Independent academic work has since tested the relationship across markets and found correlations in the mid-to-high 80s and 90s — strong enough to be useful, with one persistent bias worth knowing: the metric tends to overstate small brands and understate large ones.
Binet’s own decomposition is worth carrying around too. Sustained advertising drives search growth with roughly 60% coming from long-term effects and 40% from short-term, which was his headline figure; the category-level splits in his deck averaged closer to 65/35. Either way, the majority of the effect is the part that decays slowly. You cannot buy it with a burst.
The bill for ignoring it
Here is the cost, stated plainly. If brand search is where created demand shows up, and you do not track it, then every decision you make about brand investment is being made blind — and the decisions will drift toward whatever the dashboard can see.
That drift has a shape. Budget migrates to the measurable channel. The measurable channel reports excellent returns because it is capturing demand someone else paid to create. Finance sees the returns and asks for more of the same. Brand budgets shrink. Eighteen months later the efficient channel starts to soften, nobody can explain why, and the explanation — that the source of the demand dried up — is in a chart nobody built.
There is also a structural reason this has become urgent rather than merely suboptimal: the surface where brand search happens is being rebuilt underneath you right now.
Why the dashboard never showed it
Three reasons, and all three are features of how measurement works rather than failures of intelligence.
No clean link, no credit
Attribution wants a chain: this impression, this click, this session, this order. A brand search has no chain. There is no referrer pointing from your billboard, your podcast read, or your competitor’s customer’s memory to the search box. So the campaign-level reporting cannot credit it, the platform cannot claim it, and the model quietly drops it. What gets dropped does not get funded.
It moves at the speed of memory
Mental availability is not built in a quarter. Research from the Ehrenberg-Bass Institute puts the task in perspective: many established brands sit at 20–30% of respondents linking them to a given buying situation, and even market leaders often reach only about half. That is a multi-year construction project. A dashboard reviewed monthly will show a flat line for most of that construction, and a flat line reads as failure to anyone under pressure to justify spend.
The scatter problem
Brand queries happen in Google, in Amazon’s search bar, inside social apps, in app stores, and increasingly inside a chat window. No single dashboard aggregates them. Each platform shows you its own slice, which means the whole is nobody’s job. This is the least glamorous reason and probably the most consequential.
The 2026 complication: the AI does the persuading
Now the part that changes the argument. AI assistants have become a genuine influence on brand choice, and almost none of that influence shows up as AI traffic. Which is either a measurement crisis or the best thing that ever happened to brand search, depending on whether you are watching the right number.
The number that reframes everything
Similarweb tracked opted-in US desktop users through the second half of 2025, watching what people did after ChatGPT recommended a specific brand in finance, travel and beauty. Users recommended a brand were 2.5 times more likely to visit it within seven days than its direct competitor — and the study excluded anyone who had named the brand in their prompt or visited its site in the previous month, which is the right kind of rigour.
Then the interesting part. Of the visits that followed an AI recommendation, only 8.8% arrived as a visible AI referral. Nearly 56% arrived through search — people closing the chat, opening Google, and typing the brand name. For visits with no AI involvement, search accounted for about 40%. So the AI recommendation did not send you traffic. It sent you branded queries, which your analytics then filed under organic brand search and gave no credit to anyone.
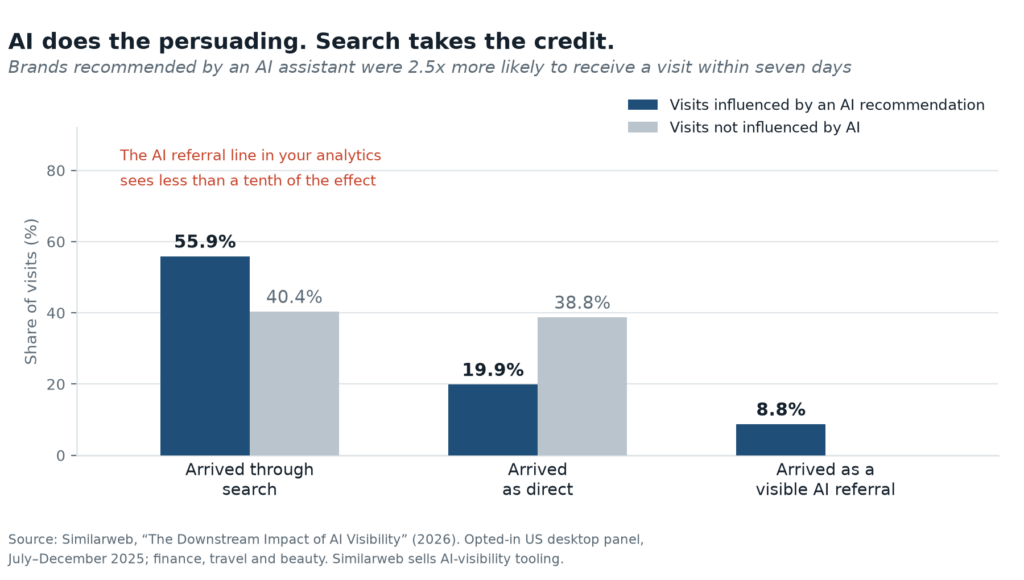
The recommended visitors also behaved differently once they arrived — around 12 pages and 11.8 minutes, against 6.5 pages and 5.6 minutes. That is the profile of someone who did their comparing in the chat window and is now confirming.
The honest caveats are real and Similarweb states them: this is observational clickstream data, not an experiment, covering US desktop only in three verticals, and Similarweb sells AI-visibility tooling. Rand Fishkin, who contributed to the work, raised the questions that matter — would these people have found the brand anyway, does it hold for small brands, and how large is the effect relative to other channels. Keep those caveats attached to the finding, because the finding survives them.
Your brand name is now a contested page
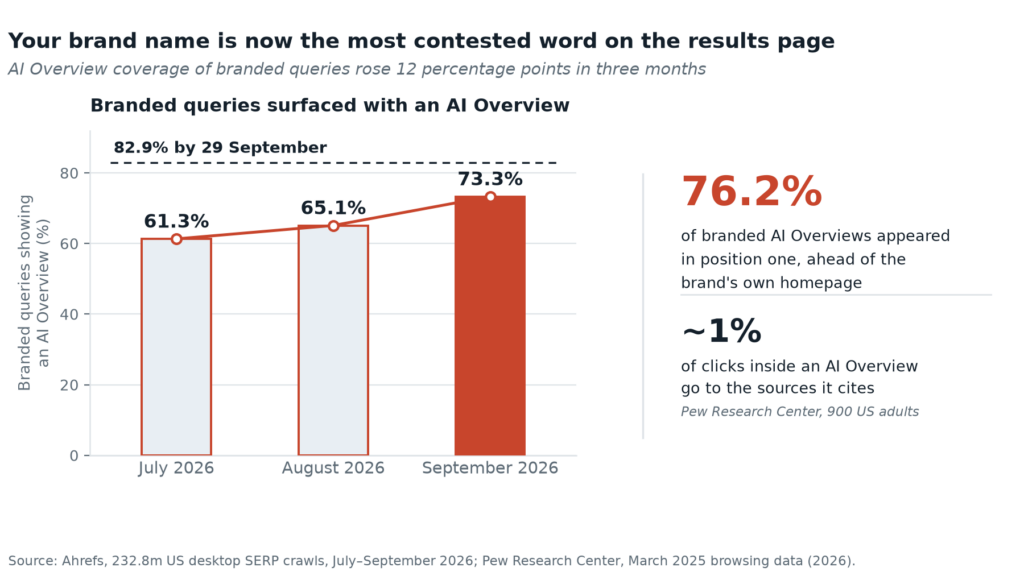
While all that was happening, the search result for your own name stopped being yours. Ahrefs analysed 232.8 million US desktop search results between July and September 2026 and found AI Overviews appearing on 82.91% of branded queries by late September, up from a 61.3% monthly average in July. Of the branded AI Overviews in their brand-name panel, 76.2% sat in position one — above the company’s own homepage.
Now add the click behaviour. Pew Research Center put a representative panel of 900 US adults under a month of browsing observation in March 2025 and found that clicks to sources cited inside an AI Overview happened in about 1% of AI Overview visits. When an AI Overview appeared, clicks on traditional results fell from 15% to 8%, and the share of sessions ending right there rose from 16% to 26%.
Sit with that. The query that used to be your safest traffic — someone typing your exact name — is now the query where a summarised, third-party version of you can answer first, and almost nobody clicks through. The volume may even go up. Brand search rising while brand traffic falls is not a contradiction. It is the new normal, and it is exactly why tracking the volume without watching the surface is not enough.
One thing that did not happen
It is worth saying clearly, because a lot of content gets this wrong. AI Overviews have not swallowed navigational search. In the randomised field experiment by Saharsh Agarwal and Ananya Sen, with 1,065 US Chrome users and pre-registered on the AEA registry, the 38% drop in outbound organic clicks was concentrated in informational queries — 53% of which triggered an AI Overview. Navigational queries triggered one only about 6% of the time, and transactional about 15%. Pure brand navigation remains the least exposed category of search there is.
So the threat is not that people stop searching for your name. The threat is that when they do, the answer arrives before your link does — and the query itself is now an influence channel you are not crediting.
How to actually run it
Four moves, in order of how much they will change your decisions.
Aggregate the signal into one line
Pick your surfaces — Google, Amazon, your app store listings, the assistants — and build one branded-demand index that you review on the same cadence as pipeline. Google Search Console now has a branded queries filter, announced in November 2025 and expanded to all eligible properties in March 2026, which separates branded from non-branded automatically. Two warnings: it depends on Google’s own AI-assisted classification, so expect occasional mislabels, and it is available only on top-level properties with enough query volume to qualify. Spot-check it against your own list of brand terms and common misspellings.
Do not blend this into your ROAS reporting. Give it its own line. The moment it shares a number with anything else, it will be subordinated to whatever converts faster.
Read the slope, not the snapshot
This is the single most common mistake I see. Brand search is noisy month to month and glacial year to year. Binet recommends a six-to-twelve-month rolling average for share of search precisely because the raw line will make you act on randomness. What you are looking for is direction and second derivative: is the trend bending up, flattening, or starting to roll over? A flat quarter means nothing. Three flat quarters while competitors climb means something.
Report it honestly as a lagging signal
Brand search lags. It will not tell you whether last week’s campaign worked, and pretending otherwise is how metrics get discredited and abandoned. Report it in the brand-health section, next to the ROAS rather than instead of it, and label it plainly as a slow indicator. You are building a second ledger — the one that tracks what you own rather than what you rented.
Set the alert threshold
The most valuable use is defensive. Because share of search leads share of market, and can lead it by up to a year in considered-purchase categories, a sustained decline is an early warning that arrives before the sales data does. Define the threshold in advance — say, three consecutive rolling quarters of decline against your competitive set — and treat a breach as a strategy question rather than a reporting footnote. That is the whole point of a leading indicator: it gives you time you would not otherwise have.
Where this argument breaks
I would not trust a piece that only gave you the favourable half.
The 83% is a ratio, not a correlation
If you cite it as a correlation coefficient, an econometrician will correct you in public. It is the average ratio of share of search to share of market, it varies by category and country, and the IPA frames it as correlation rather than causation throughout.
Trends is not a scale
Google Trends returns a relative index, not volumes. It normalises to a peak, quantises small numbers (going from 1 to 2 is a 100% jump), and samples its data. If you need absolute volume you need a paid source, and if you need a defensible trend you need smoothing and a fixed competitive set. Get the denominator wrong and you will produce a very precise number that means nothing.
Not all search is affection
A recall, a lawsuit, a viral complaint — all of them lift brand search. Binet makes the point himself: not every search is a positive signal. The trend over time, read alongside sentiment and direct traffic, is trustworthy. A spike in isolation is not.
Generic-word contamination
Some brand names become the word for the category. When that happens your brand query volume is partially measuring the category, not you, and no filter cleanly separates the two. This is a structural limit, not a fixable error. Know which side of it you are on.
The AI measurement hole
There is still no agreed standard for what counts as AI referral traffic, and every published figure comes from a vendor with a product in the category. Estimates of AI’s share of site visits sit under half a percent in the largest independent panels, while a study like Similarweb’s shows most AI influence never registers as AI traffic at all. Both are true. The visible channel is small; the invisible influence is not. Until someone builds a neutral standard, treat AI measurement as directional.
What to do Monday morning
Build the branded query line this week. Pull two years of monthly data from Search Console’s branded filter and from your other surfaces, set a six-month rolling average, and put it next to your market share trend. If the two lines track within a lag of a few quarters, you now have a leading indicator with a working alert. If they diverge, you have learned something more valuable than any campaign report would have told you.
Then have one conversation with finance. Not “we need more brand budget.” Something narrower and harder to argue with: that the channel with the best reported returns is partly harvesting demand created elsewhere, that 80% of search money is going to the six-times-more-expensive side, and that the meter which would prove it has been offline for ten years. The Norwegian brands did not discover that marketing was broken. They discovered that their reporting was, and that fixing it changed where the money went.
The takeaway
Brand search volume is the metric the dashboard forgot because it could not be credited to a campaign, moved too slowly to survive a monthly review, and lived in too many places to belong to anyone. Those three flaws are exactly why it is the compounding signal. A person who types your name has already been moved by work you did — and in 2026, more often than not, that movement started inside an AI conversation that your analytics will never see.
Track the volume. Watch the slope. Read it as the scoreboard of the brand budget rather than the performance budget. And check what sits above your own homepage for your own name, because that is now the most contested real estate you own.