Attribution Without Cookies: The Models That Actually Work
The cookie apocalypse was cancelled. Then it was cancelled again. Your measurement problem is still here.
Google spent five years telling the advertising industry that third-party cookies in Chrome were finished. Advertisers rebuilt their measurement stacks around that deadline. Consent platforms were purchased, identity graphs were commissioned, and analytics teams were reorganised.
Then, in October 2025, Google retired the very technologies it had built to replace cookies, and left cookies themselves in place. The Attribution Reporting API, the mechanism long promised to measure conversions without tracking individuals, was shut down. Topics, Protected Audience, and seven other APIs went with it. The stated reason was low adoption.
Sit with that. An entire industry spent half a decade preparing for a future that never arrived, while the thing that actually broke measurement, which is the fact that you do not own the data you are measuring with, quietly got worse.
So let us talk about what genuinely works now. And be honest about where each approach fails.
The Reversal Nobody Priced In
What actually happened
The sequence matters, because most measurement decks still describe a world that ended eighteen months ago.
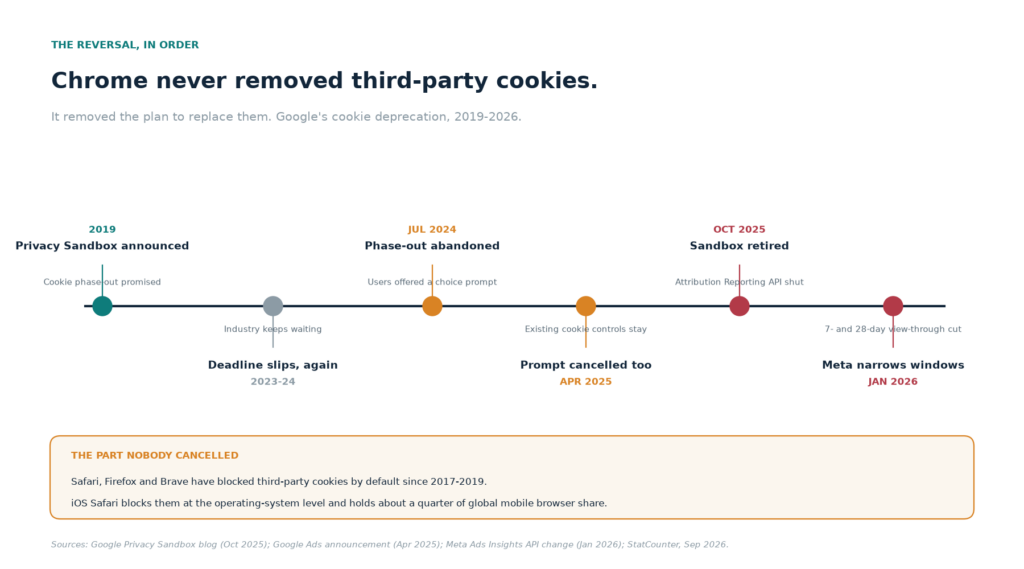
In July 2024, Google abandoned its plan to deprecate third-party cookies and proposed a user-facing choice prompt instead. In April 2025, it cancelled the prompt too, deciding to simply maintain Chrome’s existing cookie controls. In October 2025, it retired the remaining Privacy Sandbox APIs across both Chrome and Android, including Attribution Reporting, Protected Audience, and Topics.
Third-party cookies work in Chrome today. There is no revised removal date, and no replacement mechanism in development.
What did not come back
Everything else. Safari has blocked third-party cookies by default since 2017. Firefox followed in 2019, and Brave blocks them entirely. Apple restricts them at the operating system level, which means cookie persistence on iOS is measured in days, not months, regardless of which browser is in use.
Chrome holds roughly 72% of desktop browser share worldwide, which is why its reversal felt like a reprieve. But Safari carries about a quarter of global mobile browsing, and mobile is where commerce happens. The cookie survived in the one place it was least useful for cross-site measurement, and stayed blocked where it mattered most.
The regulator picked up the shovel
Here is the part that measurement teams underweight. When the browser stopped threatening your data collection, the privacy regulator did not.
Consent obligations under GDPR and the CPRA apply exactly as before. Server-side tracking does not exempt a transfer from those obligations; moving a tag from the browser to your server changes the technical path, not the legal basis.
The EU-US Data Privacy Framework survived its first serious test when the General Court upheld it in September 2025. Then, on 29 June 2026, the US Supreme Court held in Trump v. Slaughter that the President may remove FTC commissioners at will, overruling a ninety-one-year-old precedent that had protected the agency’s independence. European law firms were quick to note the implication: one of the institutional safeguards the Commission relied on when approving the framework no longer functions as it did.
The framework remains in force. Its durability is not something I would bet a measurement stack on.
The lesson: browser policy moves in public and reverses loudly. Legal exposure does not. It accumulates quietly and invoices later.
What Broke, and What Did Not
The measurement problem was never the cookie
Multi-touch attribution always required two things: the ability to observe a single person across multiple properties, and the willingness of each platform to report honestly on its own contribution. The cookie only ever supported the first. The second was never true.
What actually degraded was something more mundane. Platforms narrowed their attribution windows, replaced observed conversions with estimated ones, and stopped exposing the weights inside their models. That happened with or without cookie deprecation.
Look at what Google itself removed
Google retired first-click, linear, time-decay, and position-based attribution models from Google Ads and GA4 in 2023. What remains is data-driven attribution, which assigns fractional credit using machine learning without disclosing its calculations, plus two forms of last click. At the time, Google noted these four models accounted for under 3% of web conversions.
A model you cannot audit is not a measurement. It is a report. When a finance director asks why 0.31 of a conversion landed on paid social, the honest answer is that nobody in the room can show the arithmetic. Conversions are also reattributed for up to seven days after they occur, so last week’s report and this week’s report will disagree about the same week.
And the raw evidence is on a timer. A standard GA4 property retains user-level and event-level data for two months by default, fourteen at most. A business with a ninety-day consideration cycle is deleting the first touch before the deal closes.
That is the real loss. Not the cookie. The audit trail.
The Adoption Paradox
Everyone bought the tools
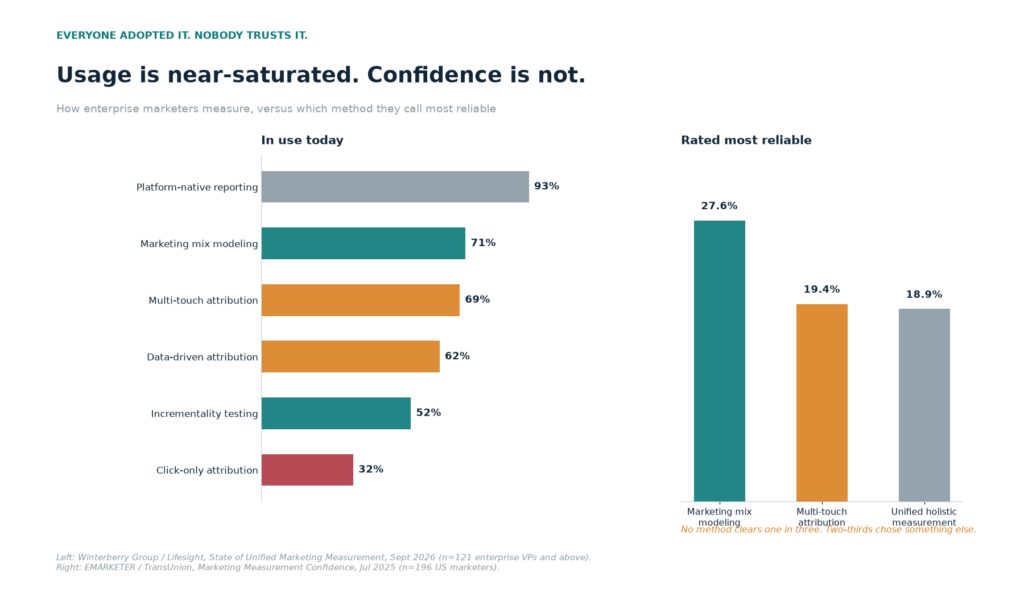
Enterprise marketing organisations have not been passive. According to Winterberry Group’s September 2026 survey of 121 enterprise-class marketers at vice-president level and above, adoption is close to saturated: 93% use platform-native reporting, 71% use marketing mix modelling, 69% use multi-touch attribution, 62% use data-driven attribution, and 52% run incrementality tests. Only 32% still use first- or last-click attribution.
Nobody believes the output
Ask the same population which method they trust most and the numbers collapse. In the EMARKETER and TransUnion survey from July 2025, 27.6% named MMM their most reliable methodology, 19.4% named multi-touch attribution, and 18.9% chose unified holistic measurement. Two-thirds picked something else, or nothing.
The BCG and Google measurement survey found something similar from a different angle: only 40% of global organisations completely trust the performance of their current measurement solutions.
The specific failures
The IAB broke the disappointment down by method, and the precision is what makes it sting. Of attribution users, 72% say it does not produce reliable or consistent results, and 72% say it does not capture performance across all channels. Of MMM users, 67% report the same reliability problem, and 61% say planning and analytics teams do not trust it. Of regular incrementality testers, 68% report unreliable or inconsistent results.
These are not complaints about adoption. These are complaints from people who already bought in.
And the channel coverage problem is worse than the reliability problem. Not a single respondent to the IAB study believes all paid channels are well represented in their MMM. Gaming is the worst served at 77%, then commerce media at 50%, the creator economy at 48%, traditional media at 46%, and connected TV at 41%.
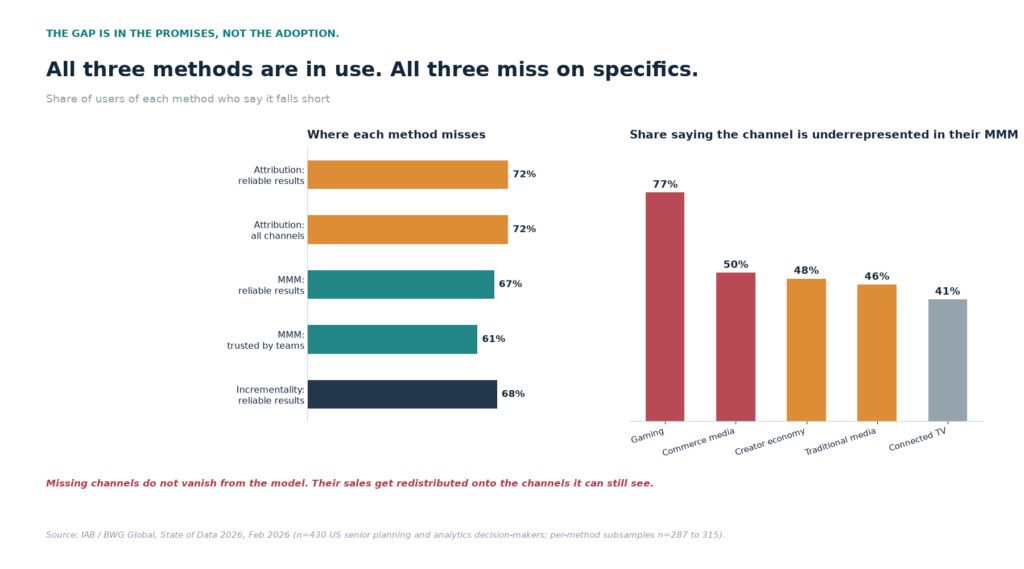
Missing channels do not vanish from the model. Their sales get redistributed onto the channels it can still see, which systematically inflates the apparent return of everything measurable.
Media Mix Modeling: The Comeback and Its Ceiling
What MMM actually does
MMM regresses aggregate channel spend against aggregate outcomes over time, controlling for seasonality, pricing, distribution, and macro factors. It produces a contribution estimate per channel across every channel at once, including television, out-of-home, and sponsorship, which attribution cannot see because it can only credit what it can tag.
It requires no individual identifiers. That is why it survived the privacy era without changing.
Why it came back
Three forces converged. Signal loss made individual-level measurement comparatively unreliable. Google open-sourced Meridian in January 2025 and shipped a substantial upgrade in September 2025, bundling Bayesian causal inference with native geo-experiment calibration. And the market moved: 46.9% of US marketers said they planned to increase MMM investment over the following year.
The Kantar and Meta study of 1,935 advertisers spending more than $1 million annually on digital found that 34% now prioritise MMM over every other measurement solution, ahead of conversion lift at 26%. Only 3% use it alone. The average advertiser runs 3.8 measurement solutions, rising to 4.2 among the largest.
Where it breaks
Meridian’s own documentation sets a floor of roughly two to three years of historical data. Below that, there is not enough seasonal variation to separate a channel’s effect from everything else happening in the business. The model will still produce confident-looking output. It will simply be confidently wrong.
MMM is also aggregate by construction. It cannot tell you which creative, audience, or placement earned a conversion. It allocates budget; it does not optimise delivery. And it is structurally backward-looking, which makes it excellent for quarterly planning and useless for Tuesday afternoon.
One further limit deserves more attention than it gets. Meridian models media effectiveness as constant over time. Every refresh therefore forces a trade-off between bias and variance: extend the window and you reduce noise but increase the risk that a strategy change two years ago is still shaping today’s coefficient.
Incrementality: The Only Causal Answer
The question attribution cannot answer
Attribution asks which touchpoint deserves credit. Incrementality asks whether the advertising caused the outcome at all. Those are different questions, and only the second one survives contact with a budget committee.
A holdout test withholds spend from a matched set of markets or users, waits, and compares. The difference between the exposed and unexposed groups is the causal lift. Everything else, including every attribution model ever built, is correlation with extra steps.
How it is actually built
Geo holdout tests require matched markets, not merely convenient ones. In a documented six-week test for Hourglass Cosmetics, ten designated market areas were selected for pre-period correlations of 0.96 to 0.98 on new customer revenue against control markets. All Meta campaigns were paused in those DMAs from 5 May to 16 June 2025. The read came from transaction data collected directly on the brand’s own site, not from the platform dashboard.
Change one variable. Freeze the window before launch. Read your own order records, because platform numbers shift with modelling and window settings, none of which you are testing.
The volume problem nobody quotes in the sales deck
Here is the arithmetic that vendors tend to skip. Detecting a 10% lift at conventional power requires roughly 1,730 purchases per arm. A 20% lift needs around 475. A 30% lift needs about 230.
A store doing 400 purchases a month across all channels cannot resolve a 10% lift in a four-week window. It can only detect a difference so large that the profit and loss statement already told you about it.
That constraint is not a flaw in the method. It is a property of experiments, and pretending otherwise is how teams produce a test that returns noise and a slide that presents it as truth.
The price of admission fell
The cost barrier genuinely dropped. Google lowered the minimum spend for an incrementality experiment from what often exceeded $100,000 to $5,000, using a Bayesian methodology it says produces conclusive results 50% more often.
Cheaper tests are not the same as sufficient tests. A smaller budget shrinks the detectable effect size proportionally. Use the lower threshold to run more tests, not to substitute for volume you do not have.
Google’s own commissioned research with BCG, across 567 senior analytics professionals, found that 80% said insights from incrementality experiments had a high impact on revenue growth. That is a strong argument, and it comes from the party selling the method, so calibrate accordingly.
Platform APIs: Fast, Walled, and Guessing
Server-side is necessary and insufficient
Conversion APIs such as Meta’s Conversions API and Google’s Enhanced Conversions recover signal lost to browser restrictions, ad blockers, and consent refusals. Sending events server-side and deduplicating against the browser pixel with a shared event ID is now baseline hygiene, not a competitive advantage.
It does not restore accuracy. The server still has to match an event to a real account, using identifiers that consent rules and opt-outs keep eroding. Recovering more signal is not the same as recovering complete signal.
The modelled conversion problem
Where direct observation fails, platforms estimate. Meta fills gaps in iOS traffic with modelled conversions, trained on the behaviour of users who did not opt out. Those estimates appear in your dashboard as ordinary conversions, with no label, no asterisk, and no confidence interval.
The window narrowed further in 2026. On 12 January, Meta removed the 7-day and 28-day view-through windows from its Ads Insights API, leaving 1-day view as the only remaining view-through option. Then in March it reclassified social interactions into a separate engage-through category with a one-day window only.
The practical consequence: the number in the dashboard is a blend of observed events, modelled events, and shortened credit windows. It is directionally informative. It is not a ledger. A sudden 15% to 40% drop in reported conversions with no change in campaign behaviour is a definitional event, not a performance event. Compare like with like before you conclude anything.
The Operating Model
Three clocks, not one number
Stop trying to force three imperfect methods into agreement. They will not agree, and the effort to make them agree consumes the analyst time you need for actual decisions.
Assign each method the question it is built to answer, and let it run on its own cadence.

Quarterly: MMM sets the envelope. Where does budget go across all channels, including the ones attribution cannot observe? Calibrate it with experimental results as they arrive.
Per test: incrementality supplies causal ground truth. Use it as the referee when MMM and platform data disagree, and calibrate your MMM priors with what the tests find.
Daily: platform APIs correct delivery. Accept that the platform is grading its own homework. Use it to optimise within the channel, never to allocate across channels.
The disagreement is the signal
Kantar found that 55% of advertisers frequently encounter contradictory conclusions across measurement tools. Most respond either by calibrating one model against another or by defaulting to whichever carries the most internal credibility, which is usually MMM.
That instinct is not wrong, but the framing is. A gap between MMM and a geo test is not a data quality problem to be smoothed away. It is information. Where MMM says a channel earns a 4:1 return and the holdout says 1.5:1, the size of that gap tells you how much of the return is brand halo, how much is measurement artefact, and how much of your budget has been funding a story rather than a result.
The confidence problem is the real problem
TransUnion found in October 2025 that measurement confidence had plateaued, with 54.1% of marketers reporting no year-over-year change and 14.3% reporting decline.
You will not fix that with a better model. You fix it by being able to show your work. That means owning the collection, holding raw paths beyond the platform’s retention window, and documenting which number came from which method and why.
What To Do This Quarter
Audit your inputs before your models. Reconcile MMM spend data against your actual media budget, line by line. Missing spend does not disappear; it gets redistributed onto the channels you can see, inflating their apparent returns.
Run one test on your largest channel. Not your most interesting channel. Your largest. If it clears roughly $100,000 a month, a six-week geo holdout will produce a decision-grade read at acceptable revenue risk. Do not run a two-week test to save time; the window is where most first tests fail.
Pick one attribution window and freeze it. Write it into your reporting contract and stop changing it. Switching windows mid-flight makes every period-over-period comparison meaningless, and 2026 has already handed you two such switches.
Separate the three numbers on the dashboard. Label modelled conversions distinctly from observed ones. If your reporting cannot distinguish them, nobody downstream can tell how much of the reported return was measured and how much was estimated.
Do not buy a single source of truth. The market has stopped believing in one: the average advertiser runs 3.8 methods, and among the largest, 4.2. Budget for integration and interpretation, not consolidation.
The Takeaway
The cookie’s death was announced, scheduled, rescheduled, and then cancelled, twice. What survived all of it was the underlying constraint that measurement leaders keep rediscovering: you cannot model your way out of data you never collected, and you cannot audit a model whose arithmetic is hidden from you.
The models that work without cookies are not new. Media mix modelling is decades old. Incrementality testing is older than the internet advertising industry that now treats it as an innovation. What is new is the willingness to run them honestly, to admit that each one is imperfect in a specific and predictable way, and to stop pretending a single dashboard number can carry the weight of a budget decision.
The marketers who get this right will not have the cleanest attribution. They will have the clearest account of what they know, what they estimated, and what they do not know yet. That is a smaller promise than the cookie era made. It is also the only one that survives an audit.