Insight: Why Event Marketing Got Measurable Before It Got Better
In one year, the event industry solved two problems it had complained about for a decade. Difficulty proving ROI fell from 70% to 40%. Satisfaction among deeply integrated organisations sits at 62%, against 37% for everyone else. Budgets stopped bleeding. The channel became defensible in a conference room full of CFOs.
And in that same year, the share of organisers calling their own networking “very effective” collapsed from 46% to 15%.
That 31-point collapse is the most interesting number in the category, and almost nobody is talking about it. It looks like a data artefact. I think it’s the actual finding.
The mechanism: we optimised for the metric that saved us
Here’s the incentive nobody designed on purpose.
Events spent the digital decade losing budget arguments because they couldn’t produce clean attribution. When integration finally arrived — Forrester found two-thirds of organisations wiring their event platform into the sales stack, a 44% year-on-year jump — events became provable. Money returned.
But what does a provable event look like? It looks like this: a scanned badge, a session attendance record, a demo booth visit timestamped into the CRM, a lead score by Thursday. All of it measurable. All of it short.
Now recall what the academic evidence says about where in-person value actually lives. The PNAS Nexus study by Zajdela and colleagues — nine conferences, 12,000-plus pairs of potential collaborators — found that formal, scheduled interaction does more of the work in virtual settings, while informal interaction carries far more weight in person. The corridor, not the keynote.
The corridor does not produce a timestamp. It produces a conversation that becomes a partnership eight months later, attributable to nothing.
So the industry did what industries do under measurement pressure: it managed to the metric it could see. Denser agendas. Shorter sessions. More touchpoints per square metre. Every one of those choices improves the number that justifies the budget, and every one quietly taxes the thing that made the budget worth having.
Why the numbers moved in opposite directions
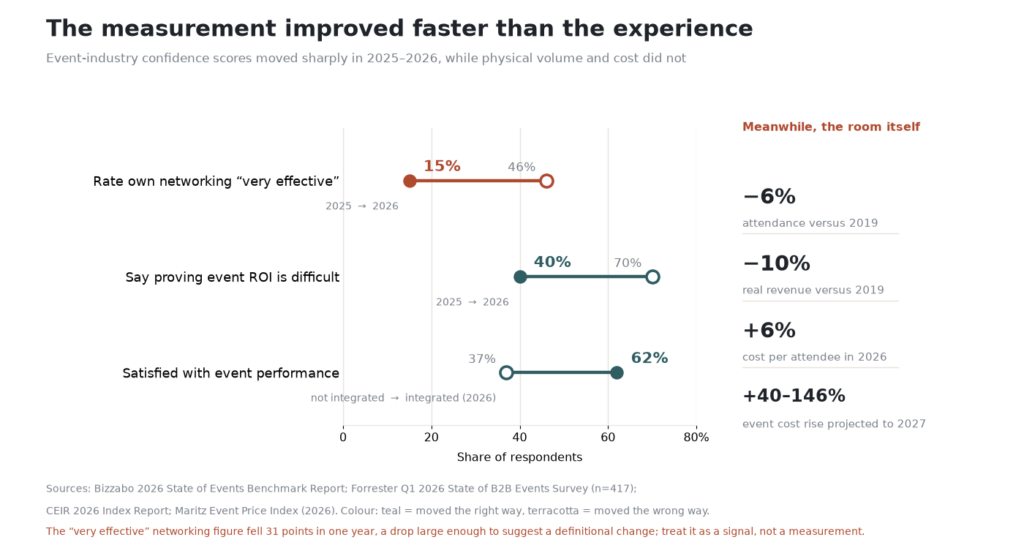
Read the two panels together and the shape is unmistakable. Confidence climbs. Volume falls 6%, real revenue falls 10%, cost per attendee rises 6% with line items projected up 40% to 146% by 2027.
Which means the same budget now buys a smaller room. Fewer attendees, more expensive each, and — Forrester’s finding — nearly 70% of organisers cutting event count while promising to protect the experience. Protect it with what? The experience budget was the first thing cost inflation ate.
The second-order effect nobody priced in
Here’s the part that should worry field marketers more than any cost line.
Freeman’s 2025 survey of attendees and exhibitors found nearly one in four saying their most important event offered no hands-on exposure at all — and 42% of those deprioritised the vendor because of it. Meanwhile 96% said touching or testing a product makes them more confident advocating for it internally.
So the value that survives measurement pressure is exactly the value that gets cut first when costs rise, because a hands-on demo is the most expensive square metre on the floor.
The honest caveat
A drop from 46% to 15% in twelve months is too steep to be a pure change in reality. Some of it is almost certainly a definitional shift — a stricter question, a wider respondent pool, a different benchmark year. Treat it as a signal, not a measurement.
But signals in that direction rarely lie about direction. The industry learned to count what happens in the room, and in learning to count it, started designing rooms that are easier to count.
The uncomfortable conclusion: events didn’t get better. They got auditable. Those are not the same achievement, and confusing them is the most expensive mistake available to a field marketing team in 2027.