Why Trust Gaps Never Close
Every year, the same number gets published, and every year it fails to move.
In 2024, PwC asked 548 US executives and 2,515 consumers how much they trusted one another. Ninety percent of the executives said their customers trusted them highly. Thirty percent of the customers agreed. A sixty-point gap — wider than in either of the two years before.
Here is what makes that number interesting. It is not new. Trust-gap research has been running for more than a decade, in public, across dozens of markets, at the cost of millions. The findings are issued as press releases. They get covered. Executives read them. And the gap stays roughly where it was.
If your conversion rate sat at thirty percent against a ninety percent target for ten years while you published annual studies about it, you would not call that a measurement problem. You would call it a structural one. So why does nobody treat this the same way?
Because the two sides are not measuring the same quantity, and no amount of communication reconciles different units.
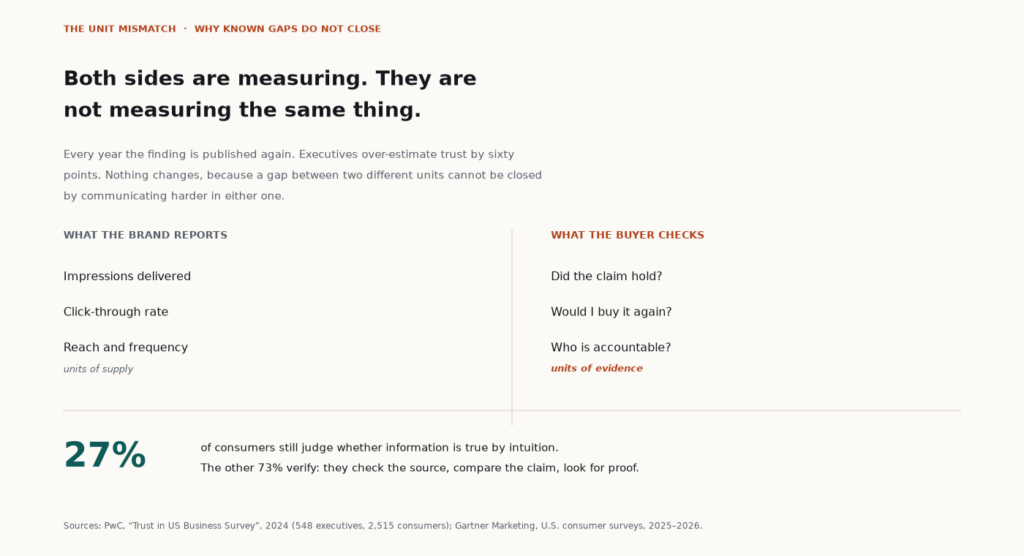
Consider what a brand actually counts. Impressions delivered. Click-through rate. Reach and frequency. These are units of supply — how much message was pushed into the world, and how efficiently. They are, by construction, things the brand controls. That is precisely why they were chosen.
Now consider what a buyer actually checks, usually in under a minute. Did the claim hold the last time I bought? Would I do it again? And the question underneath both: when this goes wrong, who is accountable? These are units of evidence — records of promises kept. They cannot be manufactured by the brand in the current quarter, because they are a byproduct of past behaviour.
A brand reporting impressions is answering a supply question. A buyer deciding whether to trust is answering an evidence question. The dashboard and the decision never touch. That is the mechanism behind a gap that gets measured forever and closes never.
It gets worse, because the buyer’s half of the equation has changed recently in a way most measurement stacks have not noticed.
By late 2025, Gartner found that only 27% of consumers still judge whether information is true by intuition. The rest have moved to verification: they check the source, they compare the claim against something else, they look for a proof point. Meanwhile, generative AI pushed supply through the roof — 97% of marketing leaders now use it daily — and made the evidence question sharper rather than softer. In the same body of research, 57% of consumers said AI-heavy content made them less trusting of brand messaging, and only 11% of B2B decision-makers said avoiding AI entirely helps build trust. Fifty-three percent said the lever is transparency about how it was used.
Put those together and the mismatch becomes visible. One side has industrialized the production of supply. The other side has industrialized the demand for evidence. The gap between them is not a communication failure. It is a category error with a budget attached.
So what would actually close it? Not a campaign, and certainly not a better deck. Two things.
First, start reporting evidence alongside supply. Every metric in the weekly review that measures pushing should be paired with one that measures holding: retention by acquisition cohort, realized price premium versus the category, referral share of new business. Not because they are softer, but because they are the units the buyer is actually using.
Second, stop treating the gap as a perception problem to be corrected upward. The sixty-point distance is not executives being wrong about an audience; it is executives counting their own output while the audience counts something else. You cannot close that by explaining your output more persuasively.
The gap has survived a decade of being measured because measuring it was never the missing step. Reconcile the units, and the number stops being a permanent feature of the industry and starts being a finding.