Why China’s Demand Doesn’t Revolve Around 618 and Singles Day
Every foreign marketing plan I read about China has the same shape. A spike in June. A bigger spike in November. Flatlines everywhere else. 618 on one side, Singles Day on the other, and a long grey stretch in between that gets labelled “brand building” because nobody can justify spending real money on a month that apparently contains no demand.
That picture is a data error, and it is an expensive one.
Start with the two spikes, because they are real. Singles Day 2025 moved an estimated ¥1.695 trillion across platforms in 36 days, up 14.2% — roughly 13% of the entire year’s online physical-goods retail, which came in at ¥13.09 trillion, up 5.2%, according to the National Bureau of Statistics. 618 2026 added ¥863.6 billion on the same measurement basis, essentially flat year on year, per the third-party monitor Syntun. Add the two windows together and they carry roughly one fifth of the country’s online goods sales.
Now the part that gets misfiled: the other four fifths. About 80% of China’s online physical-goods retail happens outside the two mega-sales — and inside that 80% there are real, predictable, nameable peaks that most global teams never plan for. The New Year Shopping Festival alone moved ¥989.7 billion in online retail between January 19 and February 8, 2026, according to the Ministry of Commerce — in three weeks, more than 618 did in its entire 37-day run. It is the biggest gifting window in the country, and it is almost invisible in Western planning decks.
The mega-sales are events. The seasonality underneath them is a rhythm. The brands that only plan the events are crowding the two most expensive windows in retail while leaving the other 363 days to whoever bothered to read the calendar.
What the Two-Festival Lens Hides
The Lunar Anchor Keeps Moving
China’s deepest demand rhythms run on a calendar that does not sit still. Spring Festival was January 29 in 2025, February 17 in 2026, and will be February 6 in 2027 — a 19-day swing in two years. Qixi moved from August 29 to August 19. Mid-Autumn slid from October 6 (absorbed into the 2025 Golden Week) to September 25 in 2026. The 2026 Spring Festival holiday ran nine days, February 15–23, and key retail and catering enterprises still posted average daily sales up 5.7% year on year.
None of this is exotic trivia. The single biggest consumption event in the Chinese year is lunar-locked, and a brand that plans Spring Festival on a fixed solar date will miss it roughly half the time. The platforms don’t make this mistake — their campaign calendars are rebuilt around the lunar date every year. The foreign planner who anchors to a solar spreadsheet inherits the error for free.
The Category Curves Live Below the Aggregate
The aggregate curve is a blur. The category curves are where the money actually is. Cosmetics peaks at 38 (March 8), at 618 and at 11.11; the category grew 5.1% in 2025, and the 38 festival has become beauty’s true season-opener, with home-beauty devices and loungewear leading livestream presales this year. Jewelry peaks at Spring Festival, at 520 and Qixi, and in October — jewelry retail jumped 37.6% in October 2025 alone, and the full year finished at +12.8%. Food peaks at Spring Festival, where food sales at key retailers rose 23% during the 2026 holiday. Travel peaks at the Golden Weeks: 8.26 billion domestic trips and ¥738.4 billion in spending in the seven days of the 2026 National Day holiday alone, per the Ministry of Culture and Tourism. Electronics peaks at 618, which is still JD’s house.
Add the policy windows and the map gets even more category-specific. Communications equipment rose 20.9% in 2025, furniture 14.6%, home appliances 11% — much of it pulled forward by the trade-in subsidy, which is why those categories then cooled in 2026. Aggregate seasonality tells you when the country spends. Category seasonality tells you when your category spends. They are different answers, and only one of them is actionable.
The Micro-Cycle Runs Underneath
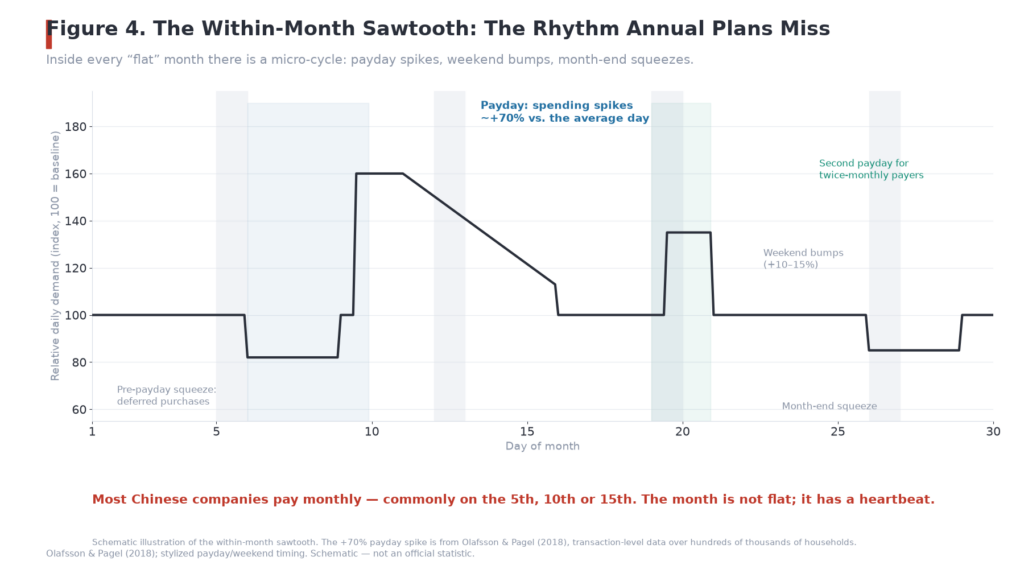
Beneath the macro rhythm there is a within-month rhythm that annual planners never see. The cleanest evidence is academic: transaction-level data covering hundreds of thousands of households shows daily spending jumps roughly 70% on payday versus the average day, and the spike holds even for households with savings (Olafsson & Pagel, 2018). Chinese salaries typically land on the 5th, 10th or 15th — so there is a national heartbeat inside every month, plus weekend bumps and a recognizable month-end squeeze.
No one in China needs a study to believe this. Ask any platform operations manager when conversion lifts during the month and you will get the same answer: right after payday.
The Base Under the Spikes
Strip away the festivals and you still get a steady, compounding base — the everyday demand the spikes ride on top of. In 2025, total retail reached ¥50.12 trillion, up 3.7%, with online physical goods at ¥13.09 trillion and now 26.1% of everything sold. That base is where loyalty, repurchase and content engines actually compound. The mega-sale planner undercounts it because it doesn’t appear in any festival report.
Reading the Charts
Four charts, one argument: the two-festival lens flattens a calendar that is actually full.
The Full-Year Demand Curve
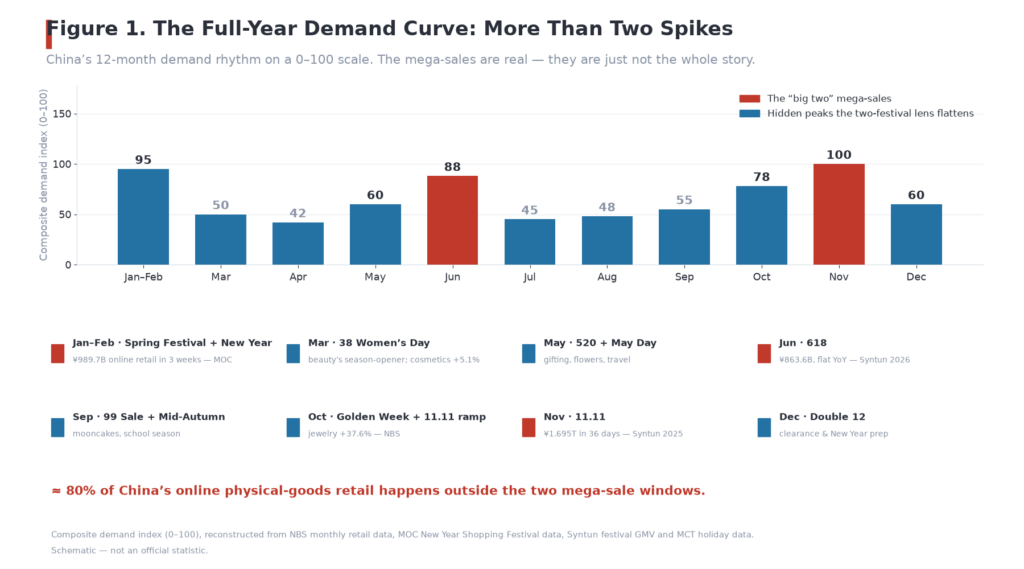
The January–February window is the biggest peak in the country, not a flatline. June and November are the two mega-sale spikes. March, May, September, October and December all carry smaller-but-real peaks that cost far less to enter. The curve says something simple: there is no dead month in Chinese retail, only months that get less press.
The Category Heatmap
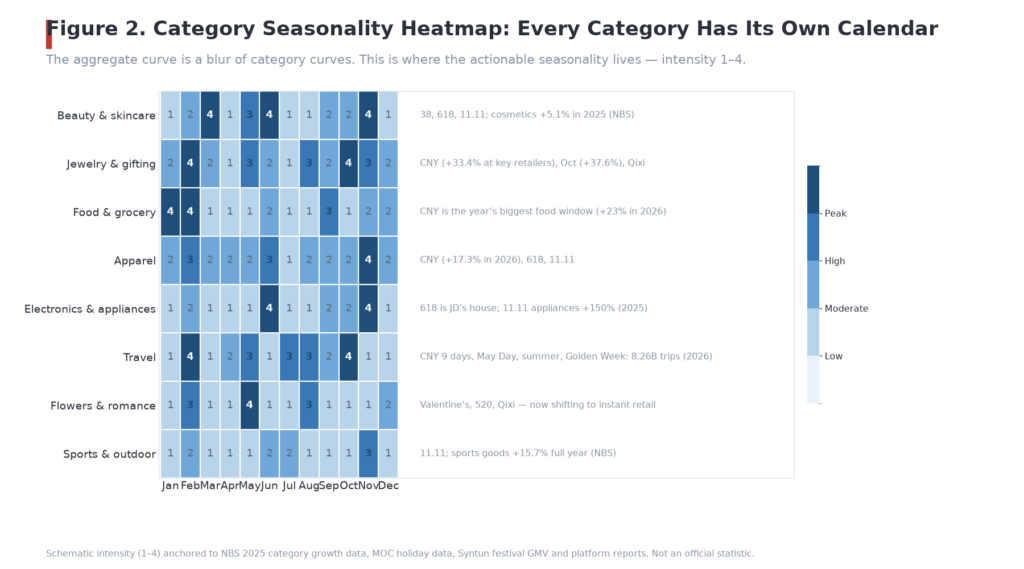
Beauty’s year looks nothing like electronics’. Food’s year looks nothing like travel’s. Plan on the aggregate and you will be in the wrong month for your category roughly half the time.
The Lunar Overlay
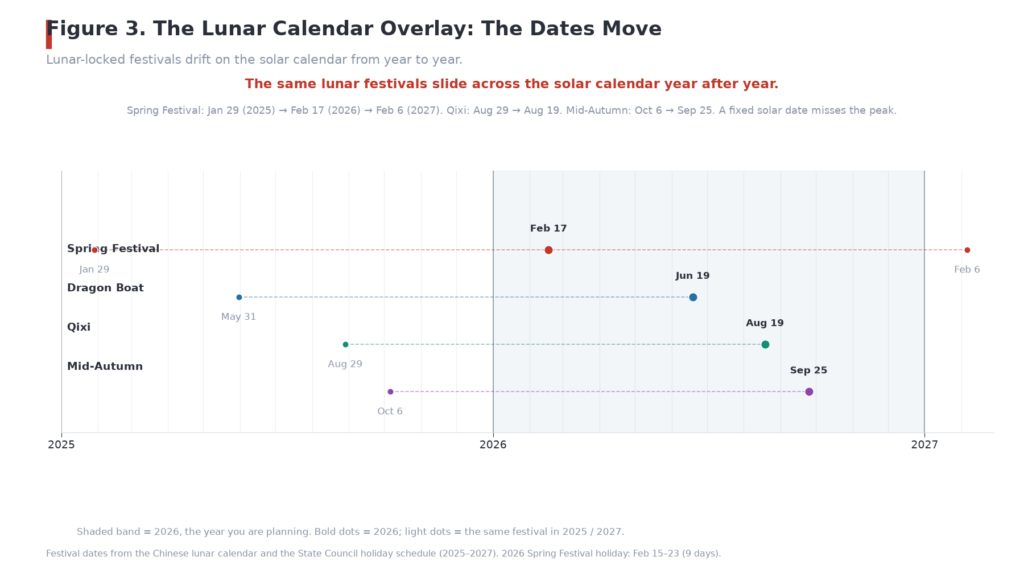
The visual point is uncomfortable: the dates you think you know are moving. A fixed solar plan drifts off the peak automatically.
The Within-Month Sawtooth
Why the Two-Festival Lens Is a Data Error
The Visibility Bias
618 and Singles Day get reported, benchmarked and celebrated. The rest of the year gets neither — so it quietly drops out of the mental model, and then out of the budget. Visibility is not the same thing as importance. The New Year Shopping Festival is bigger than 618 on a per-window basis, and most global teams have never heard of it as a planning moment. Even inside October — supposedly a “quiet” month — jewelry retail jumped 37.6%, hidden inside the 11.11 ramp.
The Flatline Misread
Calling the non-mega-sale months flat ignores three real rhythms that produce measurable peaks: the lunar calendar, the category curves and the micro-cycle. Each of them is nameable, dated and exploitable. The “flatline” is an artifact of the lens, not a property of the market.
The Concentration Risk
Everyone piles into the same two windows. That is precisely why the 2026 618 came in flat (+0.9%) and why China’s monthly retail actually shrank in May 2026 — the first decline since December 2022 — when discounts had been running so long that consumers learned to wait. The spike has gotten more crowded, more expensive and less effective. The smooth base and the quiet peaks have gotten cheaper by comparison, because fewer brands show up.
The Romance-Economy Warning
The 2025–2026 collapse of 520 and Valentine’s Day is the best warning in the data. The share of 520 spending paid by men fell from 87% in 2019 to 65% in 2025 (iiMedia Research), and online flower sales fell roughly 40% year on year during the 2025 and 2026 events. But here’s the twist: instant-retail flower orders exploded — JD’s same-city service saw flower orders up over 1,200% month on month on 520 2026, and SF City reported flower delivery orders up over 1,000%. The romance spending didn’t die. It moved channels, and the planners anchored to the old e-commerce playbook saw a collapse that was actually a migration.
Manufactured festivals can fade or move. The rhythm underneath them does not.
What This Means for Brands
Map the Category, Not the Industry
Build your own category × month map before you write a budget. Beauty peaks at 38, 520 and 11.11. Jewelry peaks at Spring Festival, Qixi and October. Food peaks in January–February. Travel peaks at the Golden Weeks. Electronics peaks at 618 and 11.11. Your category’s year is the only one that matters.
Plan on the Lunar Date
Spring Festival 2027 is February 6, not whatever your spreadsheet says. Put the lunar calendar in your planning system, not a solar approximation. One day off the peak is a campaign that misses the window.
Exploit the Quiet Windows
The non-mega-sale peaks are under-served, which means the same budget buys more voice there. The New Year Shopping Festival is the obvious example: ¥989.7 billion of online retail, gifting intent at its annual high, and a fraction of the competitive density of November. Add May Day and the 99 Sale as cheaper testing grounds. The quiet windows are where a mid-size brand can actually out-shout the giants.
Ride the Micro-Cycle
Time launches, seeding and paid media to the payday wave. If your category converts after payday, schedule the push for the 48 hours after the 10th, not on a Tuesday chosen by habit. The month has a heartbeat; sync your cadence to it.
Balance the Spike and the Base
The mega-sales are salience. The base is compounding. Brands that win in China do both — they show up in the crowded windows to be seen, and they keep the everyday engine running underneath, where reviews, repurchase and loyalty actually build.
The Honest Caveats
The Reconstruction Limit
Be honest about the source of the charts. Sub-mega-sale seasonality is far less reported than the mega-sales themselves, so the hidden curves here are reconstructed from official monthly retail data, holiday data and festival GMV rather than published as a single official statistic. The shape is right; the exact heights are directional.
A Rhythm, Not a Law
Seasonality is probabilistic. A weather shock, a policy change or a viral event can break the pattern — see what the trade-in subsidy did to appliance demand in 2025, or what consumer caution did to May 2026. Use the map as a prior, not a promise.
Lunar Complexity Has a Cost
Planning on a moving calendar adds operational complexity, which is exactly why so many teams default to the fixed solar mega-sales. That convenience is the price of missing the lunar peaks. Most teams should pick the two or three lunar moments that matter for their category and calendar them properly, rather than trying to track all of them.
Don’t Choke on Every Bump
Chasing every micro-curve fragments the budget. The discipline is to map the material peaks — the ones that move revenue for your category — and let the rest pass. A rhythm is a set of priorities, not a to-do list of forty dates.
What Changes Next
AI Learns the Rhythm
The hidden curves are becoming data-predictable. During 618 2026, JD’s AI shopping assistant 京言 covered roughly 80 million users, up over 200% year on year, and during 11.11 2025 Taobao’s AI search handled close to 50 million shopping questions. When AI both forecasts the seasonality and assembles the shortlist, the brands that win will be the ones whose product data lets the model describe them accurately — and whose campaigns are scheduled on the real rhythm, not the headline dates.
The Calendar Gets Invented — and Fades
China’s calendar is made, not just read: 520 was a homophone joke that became a national gifting date, and platform brand-days keep inventing new moments. But 2025–2026 showed that manufactured dates can also fade when the emotion behind them cools. The lesson cuts both ways: new festivals are cheap to test, and none of them are safe to treat as permanent.
The Playbook Travels
The Chinese festival machine is exporting. TikTok Shop ran its first global Black Friday season in 2025 — US Black Friday–Cyber Monday GMV passed $500 million in four days — and finished the year with GMV approaching $100 billion and roughly 400 million active consumers, per company disclosures and industry reporting. The content-commerce festival playbook China built is now running on the world’s calendar, which means the same question applies everywhere: are you planning the events, or the rhythm?
The Verdict
China’s seasonality is a rhythm the mega-sale obsession made invisible. The brands that chart the full curve — lunar, category, micro-cycle — and plan the rhythm rather than the events will capture the predictable, under-competed demand the two-festival lens leaves on the table.
The Takeaway
Your China calendar is not a list of two dates. It is a full-year operating system with a moving lunar core, category-specific peaks and a monthly heartbeat. The mega-sales will keep getting crowded, expensive and noisy; the other 363 days are where the compounding happens.
Stop treating 618 and Singles Day as the plan. Treat them as two items on a calendar that rewards whoever reads the rest of it.