The Numbers Are Real, the Forecast Isn’t: Reading China’s GEO Market Correctly
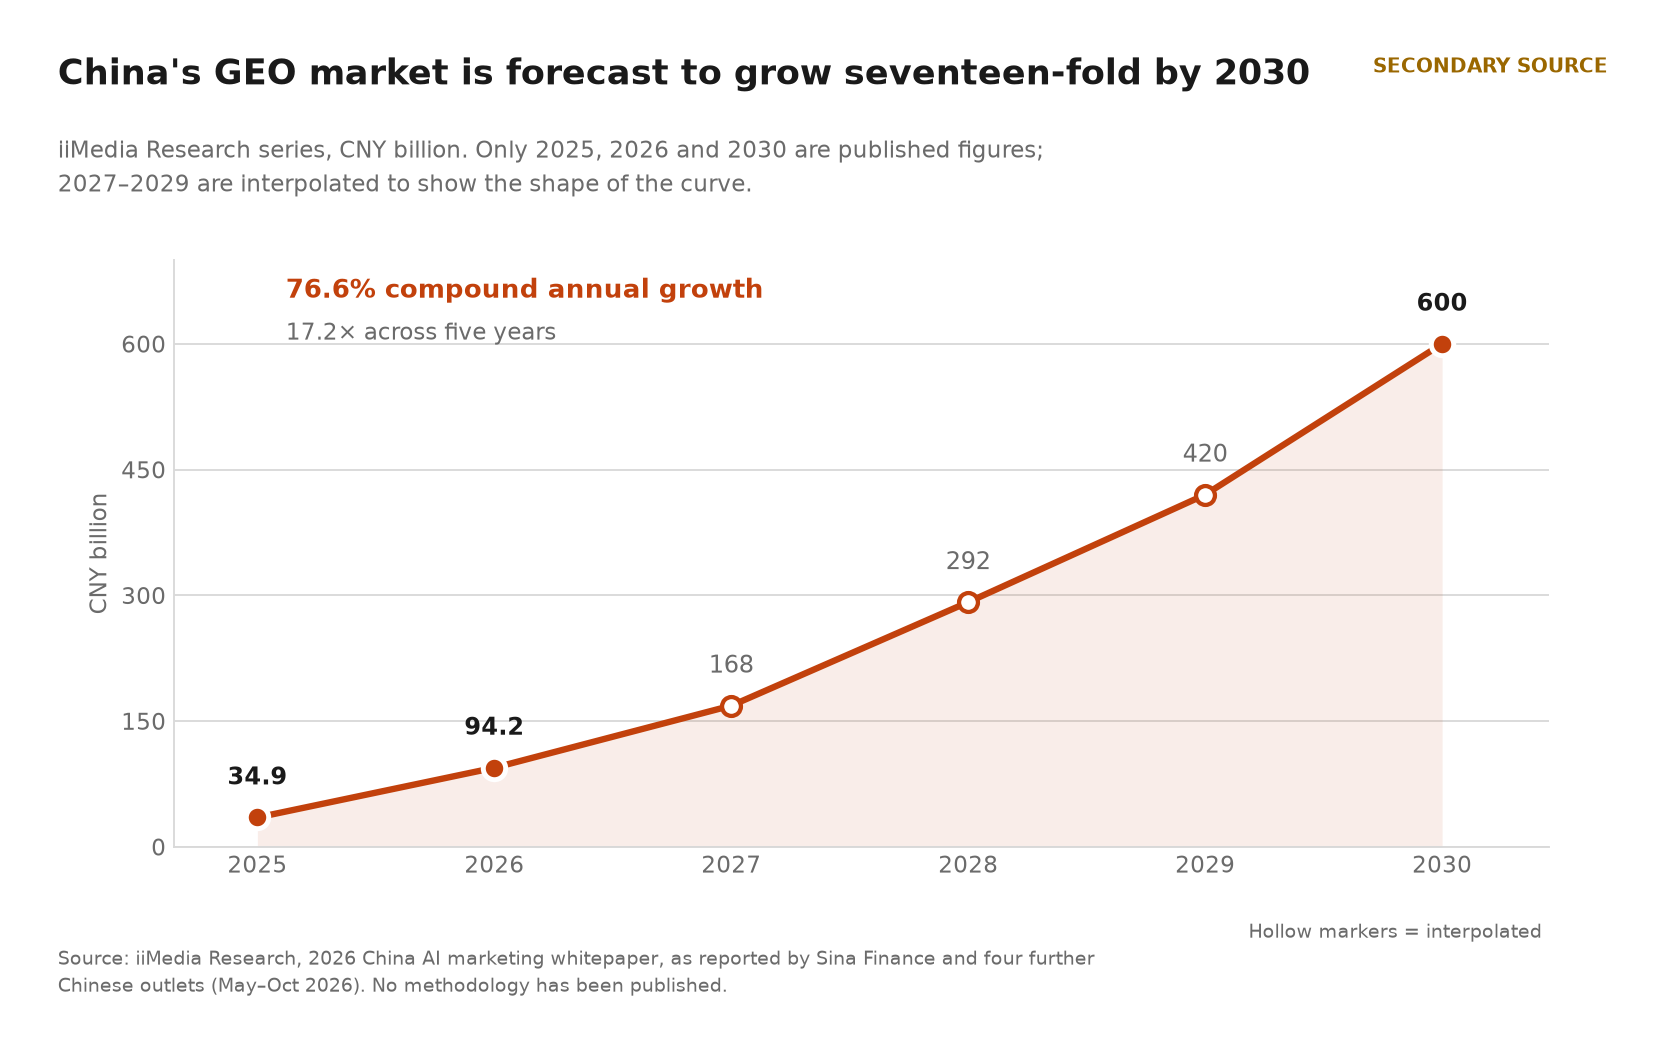
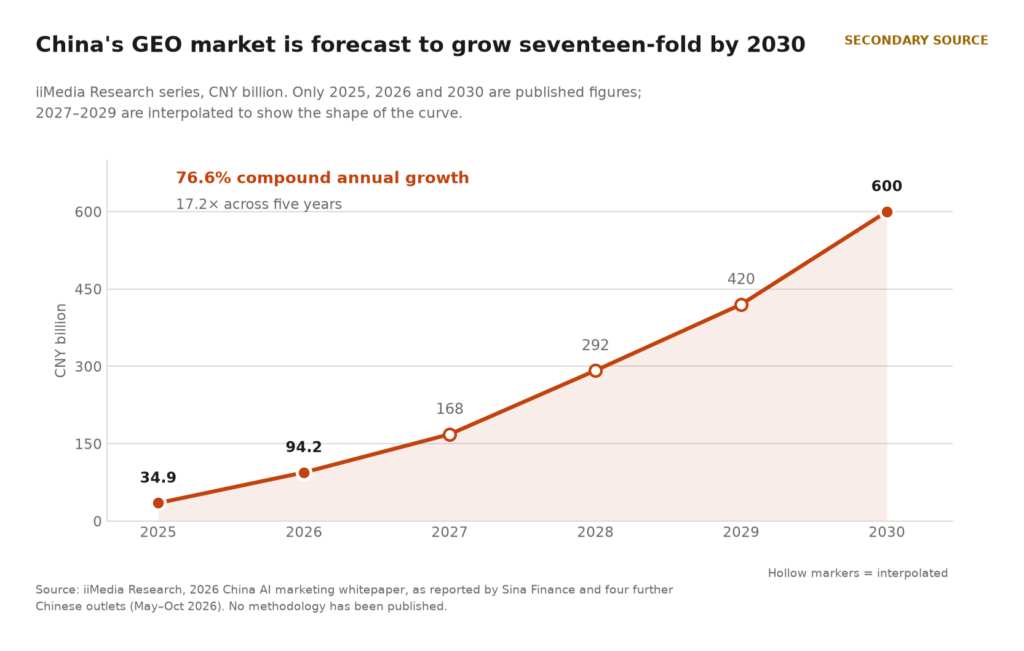
An iiMedia Research forecast puts China’s generative engine optimization market at ¥34.9 billion in 2025 and above ¥600 billion by 2030. That works out at roughly 76.6 percent compound annual growth sustained for five years. The figure now appears routinely in pitch decks from Shanghai to Singapore. Demand for the category is real, and can be traced to a government statistics agency. The market-size number that supposedly measures it cannot be verified at all, and why it cannot turns out to be the most useful part of the story for anyone outside China.
The numbers doing the rounds
iiMedia, a Guangzhou consultancy, publishes an annual whitepaper on AI-driven marketing. Its 2026 edition puts China’s GEO industry at ¥34.9 billion for 2025, ¥94.2 billion for 2026 — a 169.7 percent jump — and more than ¥600 billion by 2030.
We could not obtain the whitepaper. Four separate Chinese outlets reported those three figures identically between May and October 2026, so the numbers are certainly being published. The methodology behind them is not. No sampling frame, no definition of what counts as GEO revenue, no split between software, service fees and media. A buyer should notice that absence first, because the entire forecast rests on a category boundary nobody has drawn in public.
What a 76.6 percent curve implies
The arithmetic below is ours, and it is worth doing because it tells you what kind of claim this is.
From ¥34.9 billion to ¥600 billion in five years is a 17-fold increase. Even the back half, from ¥94.2 billion in 2026 to ¥600 billion in 2030, requires about 59 percent a year for four consecutive years. Almost no advertising category in China has held that pace for that long. Livestream commerce came closest, and then only because a structural shift pulled an entire retail category onto a new channel inside roughly three years.
The forecast is therefore best read as a bet on a category boundary widening — AI-era content production, placement, tooling and retainers counted together — rather than as a prediction of what brands will pay for GEO services. Both readings are defensible. They imply wildly different budgets.
Two research houses, 27 times apart
If the China figure is hard to audit, the global ones are worse.
iiMedia’s worldwide series puts GEO at $11.25 billion in 2025, $29.17 billion in 2026 and $266.25 billion by 2030. Market Decipher, in a report distributed through PR Newswire in June 2026, puts the global market at $1.09 billion for 2026, reaching about $32.92 billion a decade later.
Same year. Same declared scope. A factor of 26.8.
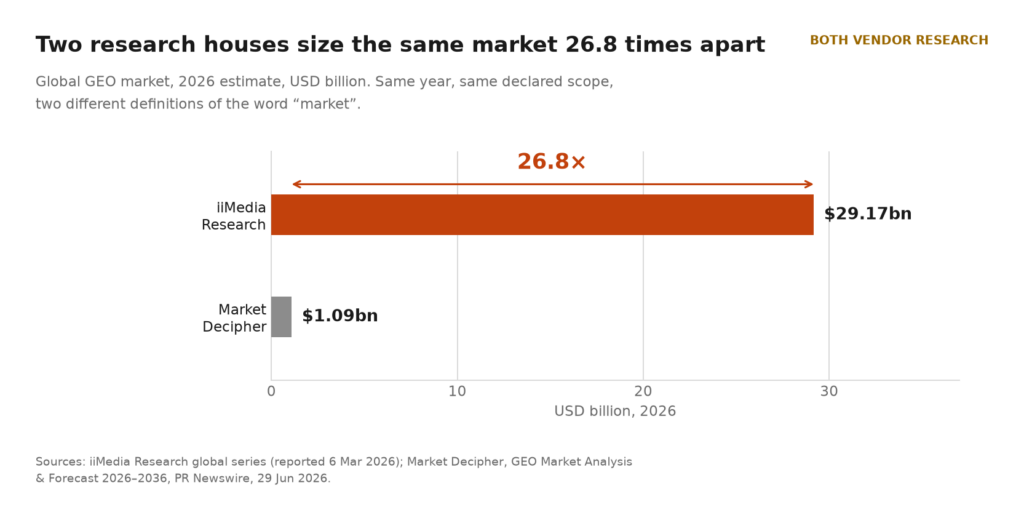
That gap is the most useful measurement in this article, because it does not come from a dispute about data. It comes from two firms using one word for different things. Market Decipher’s figure behaves like a software and services market: it reports average enterprise contract values of $185,000 a year, up from $72,000 in 2023, which is service-fee scale. iiMedia’s behaves like an advertising-adjacent pool, and its growth rates above 150 percent a year look like media spend ramping rather than licence revenue.
A marketer who reads either number as the size of the opportunity is reading a definition, not a market.
Where the evidence is solid
Set the market sizing aside and the picture sharpens immediately.
On 29 September 2026 the China Internet Network Information Center published its Generative AI Application Development Report 2026. It recorded more than 700 million generative AI users in China by mid-2026, with penetration above 50 percent of the population. That is up from 602 million at the close of 2025.
More important than the headcount is the usage split. CNNIC found 76 percent of those users turn to generative AI to get answers to questions. Image and video processing follows at 47.8 percent, text tasks at 37.6 percent, and work summaries, minutes and presentations at 32.5 percent.
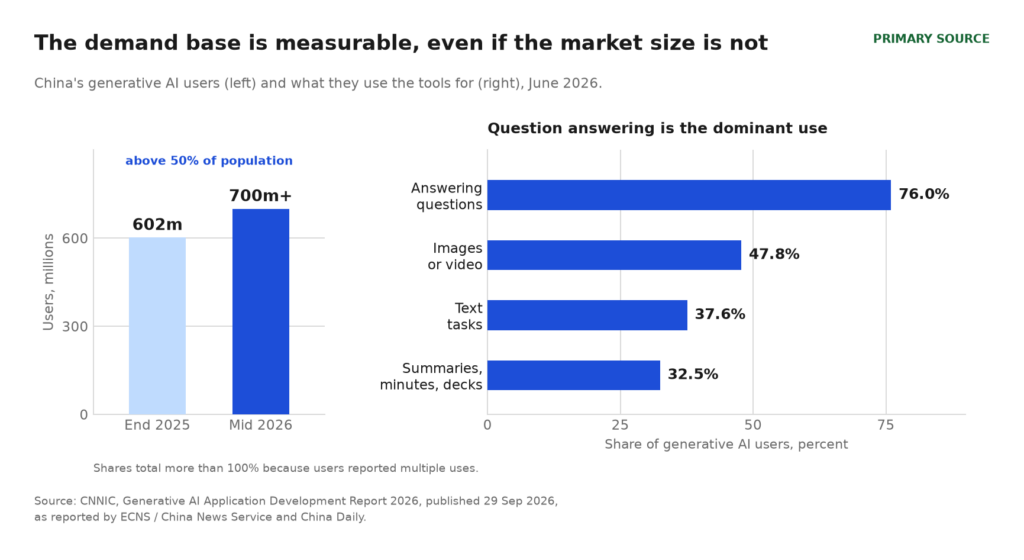
Question answering is not a peripheral use of these tools. It is what they are for. When three-quarters of a 700-million-person base treats an AI assistant as the place to ask something, search has not shrunk so much as changed address. The query still happens. It happens somewhere a brand cannot buy a blue link.
Gartner made the mirror-image argument in February 2024, forecasting that traditional search volume would fall 25 percent by 2026 as consumers moved to chatbots and virtual agents. It remains a forecast, and Gartner has published no measured replacement. But the direction is now corroborated by a government survey rather than inferred from vendor telemetry.
Why it turns into a budget line
Sentiment does not fund channels. Revenue per session does.
Adobe, measuring across roughly 1.5 trillion visits, expects traffic from AI tools to US retail sites to rise 130 percent year on year in the 2026 holiday season. A survey of 5,000 US consumers it ran alongside found AI-referred visitors producing 43 percent more revenue per visit and adding items to cart at a 32 percent higher rate. Eighteen months earlier, Adobe had reported the opposite: non-AI traffic was then worth 128 percent more.
Salesforce, analysing about 1.5 billion consumer records across 89 countries for November and December 2025, put global online sales at $1.29 trillion, of which $262 billion — about 20 percent — was influenced by AI or AI agents. Retailers that had deployed AI agents grew sales 59 percent faster than those that had not.
Read together, the two datasets explain why the money moves. Once a visitor arriving from an AI answer is worth more per session than one arriving from ten blue links, absence from those answers stops being a visibility problem and becomes a revenue problem. That is a sentence a budget holder can sign off.
What actually moves a citation
The useful academic result of the year separates how a page is engineered from how much of it there is.
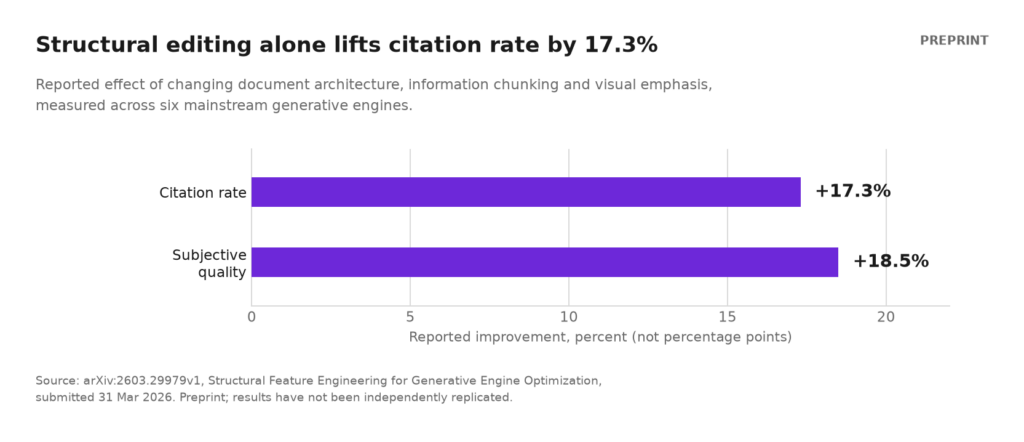
A preprint submitted to arXiv in March 2026, Structural Feature Engineering for Generative Engine Optimization, tested how document structure affects citation across six mainstream generative engines. The authors report consistent improvements of 17.3 percent in citation rate and 18.5 percent in subjective quality. They report percentages rather than percentage points, and nobody has replicated the result yet.
The mechanism still tells you something practical. The framework separates document architecture, information chunking and visual emphasis, then improves each without touching the underlying claims. Structure, not word count. None of that work resembles the mass content production that most GEO retainers in China are currently being paid for.
The measurement splits twice
A visibility score typically hides two distinct failures, and vendors seldom separate them.
The first is absence: the model names nobody in your category. The second is mention without citation: your brand appears in the answer, but no source page, quoted fact or attributable claim stands behind it. The second looks like progress on a dashboard and does nothing at the point of purchase.
Semrush’s 2026 AI Visibility Index, released in October, put numbers on how badly this compounds. Across four AI platforms and 22 categories, using data from January to July 2026, the top 100 brands shared between any two platforms averaged 63 to 70 in the UK and 70 to 78 in the US. In the UK, fewer than half of the most-mentioned brands also appeared among the hundred most-cited domains, with overlap running between 36.7 and 45.3.
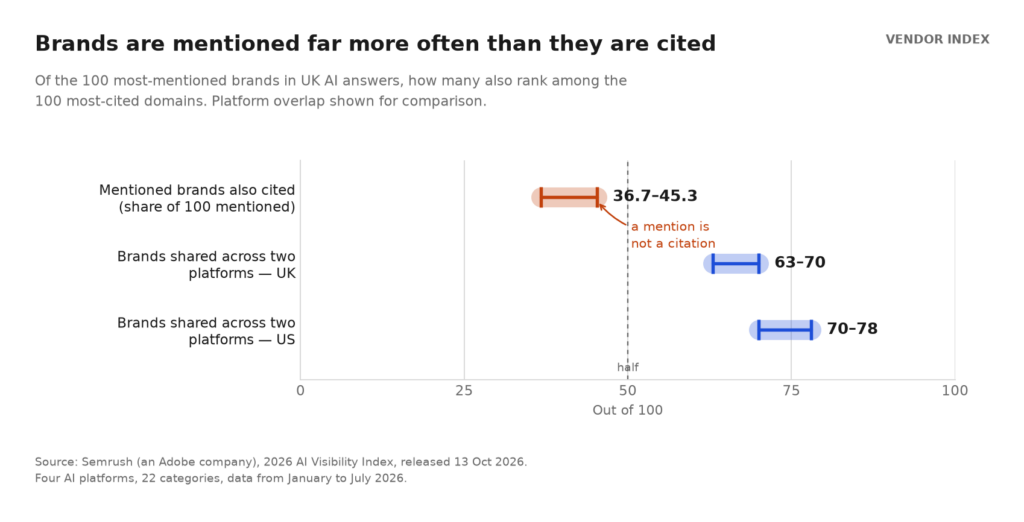
So roughly 55 to 63 of every 100 most-mentioned UK brands were not cited at all. Average one platform’s blended score with another’s and the result describes neither. This is why companies report improving AI visibility while referral traffic stays flat: they are measuring the first failure and not the second.
Three rulebooks in ten weeks
Regulation arrived in China before the market agreed on its own definition, which is the reverse of how advertising categories usually mature.
Between August and mid-October 2026, two national associations published overlapping GEO group standards in quick succession: a credibility and information-ecosystem standard in August, five standards from the China Business Advertising Association on 14 September, and three more from the China Advertising Association on 14 October, effective the 23rd. The two bodies are genuinely distinct institutions whose English names are nearly identical, which has already caused confusion in translation.
We should be transparent about the limit here: those dates and titles come from Chinese industry reporting rather than from the associations’ own published notices, which we could not retrieve. Treat the sequence as reported, not independently confirmed.
What the standards say, consistently across drafts, is more useful than their paperwork. Content must be traceable to a source. Effect must be measurable and verifiable. Deceptive inducement to place a brand inside an answer is prohibited. Three clauses, and the second has teeth: it turns “we improved your AI visibility” from a claim into something a client can demand evidence for.
What a buyer outside China should do
Treat the forecasts as direction, not as benchmarks. If a deck quotes ¥600 billion, ask which category boundary produced it, and whether the same firm’s global number sits on the same definition.
Ask for two figures instead of one: mention rate and citation rate, by platform, with sample size and date range attached. A supplier who cannot split them is selling a dashboard, not an outcome.
Fund structure and primary data. The evidence points to document architecture, clean chunking and attributable facts. That is cheaper than volume production and much harder to fabricate.
Test each market and each engine separately. The UK and US answer sets diverge, and so will yours across platforms. Averaging them produces a number that is true nowhere.
Watch the Chinese standards rather than the Chinese forecasts. Whoever codifies verification first will set the terms that procurement inherits, and procurement language crosses borders faster than vendor claims do.
What to watch next
Four things. Whether iiMedia publishes a methodology and lets the ¥600 billion claim be audited. Whether the two Chinese associations converge or keep issuing in parallel, and which set of standards turns up in actual tender documents. Whether Gartner replaces a two-year-old forecast with measured data now that 2026 is nearly out. And whether AI answer surfaces start selling placement outright, at which point GEO stops being earned visibility, becomes media buying, and every projection above needs rewriting.
Until then the defensible claim is narrow. Buying questions moved into AI answers, that movement is measurable in user surveys and in revenue per session, and budgets are following it. The market-size charts have not caught up.
FAQ
How big is China’s GEO market? No audited figure exists. iiMedia reports ¥34.9 billion for 2025 and ¥94.2 billion for 2026 without publishing a methodology, and its global series sits 27 times above Market Decipher’s for the same year. Treat published market sizes as definitions in search of evidence, and use CNNIC’s demand data as the reliable anchor instead.
Is ¥600 billion by 2030 credible? It depends entirely on what is counted. As software and service fees alone it implies 76.6 percent compound growth for five years, which no comparable Chinese advertising category has sustained. As a widened category pooling content production, placement, tooling and retainers, it is arithmetically possible. The figure means nothing until the boundary is specified.
Why do the two global forecasts differ so much? Because they measure different markets under one name. Market Decipher’s $1.09 billion for 2026 behaves like licence and services revenue, with average enterprise contracts near $185,000 a year. iiMedia’s $29.17 billion behaves like an advertising-adjacent pool growing above 150 percent annually. Neither is obviously wrong, and neither is comparable.
What does government data show about AI adoption in China? CNNIC’s September 2026 report is the strongest available source: over 700 million generative AI users, penetration above 50 percent of the population, and 76 percent using the tools to answer questions. That measures behaviour, not revenue, which is exactly why it is more useful than a market forecast.
What do the new Chinese GEO standards require? Across three 2026 documents: content traceable to a source, results measurable and independently verifiable, and no deceptive inducement to insert a brand into an answer. Dates and titles come from Chinese industry reporting rather than the associations’ own notices, so verify standard numbers before quoting them in a tender.
Does AI visibility carry across markets or platforms? No. Semrush found the top 100 brands shared between any two AI platforms averaged 63 to 70 in the UK and 70 to 78 in the US, and that fewer than half of the UK’s most-mentioned brands were also among its most-cited domains. Measure per engine and per market, or you are reporting an artefact.